XB-IMG-122660
Xenbase Image ID: 122660
|
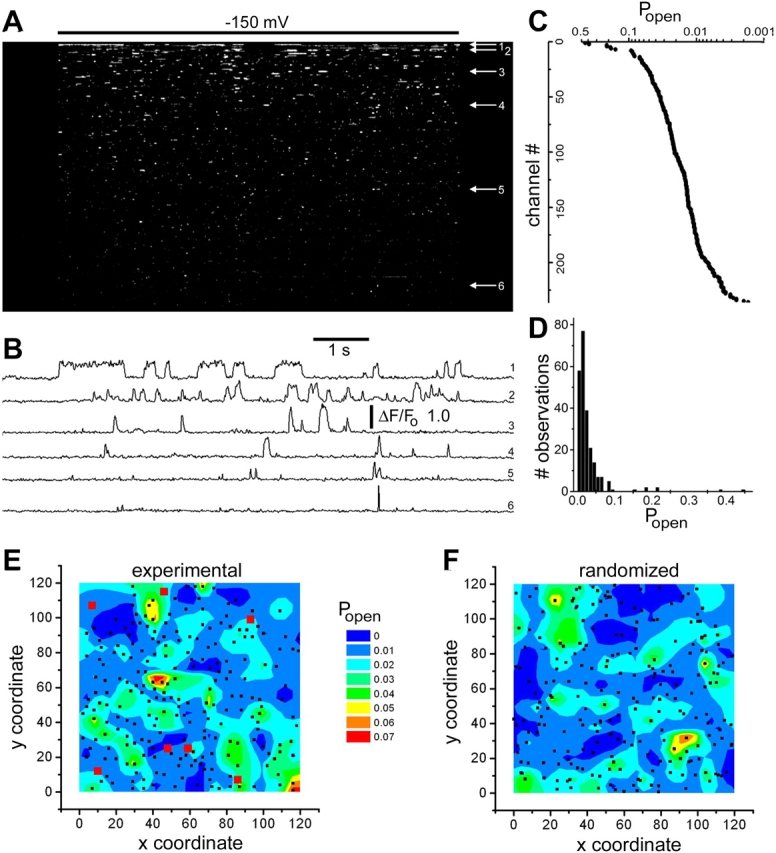
Figure 10. Spatial mapping of channel open probability. (A) Channel-chip representation, showing the simultaneous activity of 236 channels within a 40-μm square imaging field. The oocyte was continually exposed to 1 μM ACh, and the membrane potential was stepped from 0 to −150 mV for 7 s as indicated by the bar. The channels are arranged (from top to bottom) in order of decreasing open probability as calculated from the proportion of time during the hyperpolarizing pulse for which the SCCaFT amplitude exceeded one half of the mean maximal value for that channel. (B) Representative traces showing local fluorescence ratio measurements from the six channels marked by arrows in A. (C) Channel open probabilities (Popen, plotted on logarithmic scale) corresponding to the 236 channels depicted in A. Data points represent the proportion of time for which the fluorescence at that channel exceeded one half of the mean maximum during a single, 7-s hyperpolarizing step. (D) Histogram shows the distribution of open probabilities among the 236 channels. (E) Three-dimensional color contour plot showing the distribution of channel open probabilities throughout the imaging field. Same experiment as A–D. Contours depict mean Popen on a 30 × 30 grid matrix, with different colors corresponding to Popen values as indicated by the scale. Seven channels had Popen values >0.1 and were omitted from this analysis to avoid compressing the color scale. Their positions are marked by red squares, and black dots mark the positions of all other channels. (F) The same color contour analysis of Popen as shown in E, but after randomizing the x-y coordinates of the channels (indicated by black dots). Data in this figure are representative of three similar experiments. Image published in: Demuro A and Parker I (2005) Copyright © 2005, The Rockefeller University Press. Creative Commons Attribution-NonCommercial-ShareAlike license Larger Image Printer Friendly View |