XB-IMG-127799
Xenbase Image ID: 127799
|
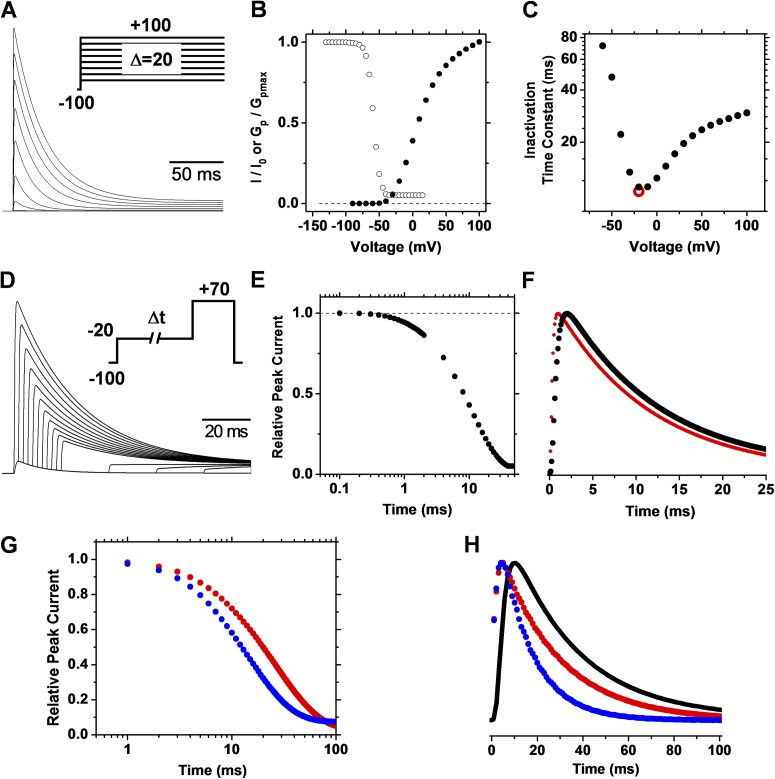
Figure 4. CSI simulation. Details of A–F are as described in the Fig. 3 legend. For comparison, the red symbol in C indicates the time constant determined from the double-pulse protocol. The conditioning pulse in D activated 14% of the peak conductance. Recovery from inactivation at −100 mV was significant within 5 ms and, therefore, we used no gap between the two pulses. These simulations were performed at 34°C to assess the predictions of the model on spiking properties at the temperature used to study the excitability of hippocampal neurons (Materials and methods; Fig. 11). Simulation parameters are given in Table S1. G and H are analogous to E and F, with simulation parameters as reported by Amarillo et al. (2008; Table S1), except the allosteric factor f = 0.45 (red symbols). The blue symbols demonstrate the result of further increasing the allosteric factor f to 0.67 and setting the allosteric factor g to 4. Image published in: Fineberg JD et al. (2012) © 2012 Fineberg et al. Creative Commons Attribution-NonCommercial-ShareAlike license Larger Image Printer Friendly View |