XB-IMG-136699
Xenbase Image ID: 136699
|
|
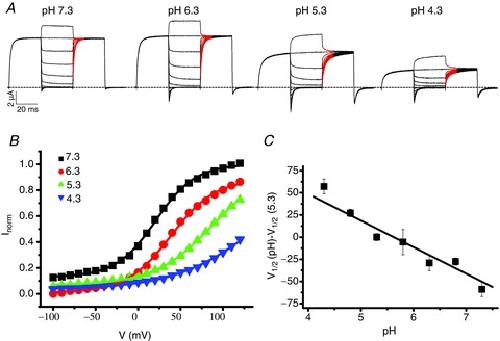
Figure 8. Voltage dependence of gating of D76H as a function of pHextA, representative current traces at the indicated pHext from one oocyte. Red lines represent the mono-exponential fit of the tail currents elicited by a post-pulse to 100 mV. The amplitude of the tail currents at the onset of the post-pulse was extrapolated from the fit. These values were normalized with the parameter Imax derived from the fit with eqn (1) to obtain the current–voltage (I–V) relationships. B, I–V relationships for the oocyte shown in A. Full lines are the fit of the data with a Boltzmann function (eqn (1)) providing estimates for V1/2 and z of 21, 39, 89, 141 mV and 1.1, 1.0, 0.8 and 0.5, respectively, for pH 7.3, 6.3, 5.3 and 4.3. C. mean values of the difference between V1/2 calculated at pH 4.3 (n= 6), 6.3 (n= 5), 7.3 (n= 7) and that calculated at pH 5.3 (n= 10) as a function of pHext. The full line represents the fit of the data with a linear function with a slope of 30.7 ± 6.4 per pH unit. Image published in: De Stefano S et al. (2013) Image downloaded from an Open Access article in PubMed Central. © 2013 The Authors Larger Image Printer Friendly View |