XB-IMG-125892
Xenbase Image ID: 125892
|
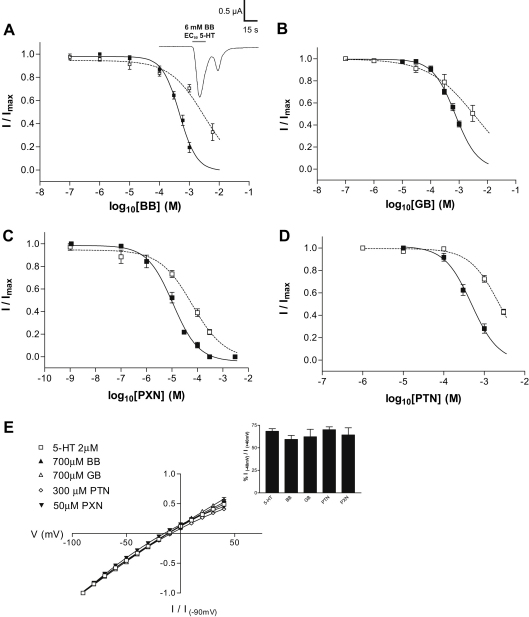
Fig. 2. BB (panel A), GB (panel B), PXN (panel C) and PTN (panel D) inhibition of the 5-HT3A (filled squares, solid line) and 5-HT3AB (open squares, dotted line) receptor EC50 responses. A inset shows the current rebound sometimes observed following the removal of high concentrations of BB. Panel E shows current-voltage relationships for 5-HT3A receptor responses in the presence of BB, GB, PXN or PTN. The curves have been normalised to the current at measured at −90 mV, and the inset shows the ratios of current amplitudes recorded at +40 mV relative to those at −40 mV. The ratios in the absence of antagonist were unaltered in the presence of BB, GB, PTN or PXN. GA inhibition is not shown as only minimal inhibition was seen at 1 mM in the 5-HT3A receptor only. Image published in: Thompson AJ et al. (2011) © 2011 Elsevier Ltd. Creative Commons Attribution license Larger Image Printer Friendly View |