XB-IMG-124625
Xenbase Image ID: 124625
|
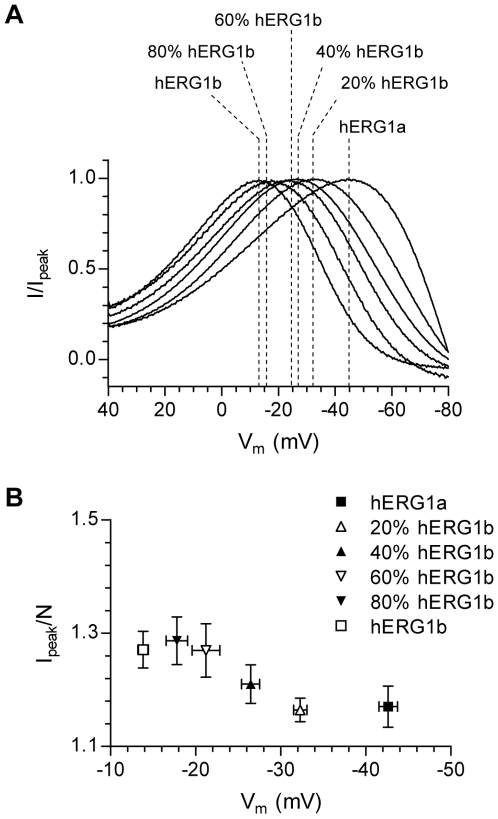
Figure 3. The ‘peak potential’ is directly dependent on the relative abundance of hERG1 isoforms.A, Representative recordings from X. laevis oocytes injected with different ratios of hERG1 isoforms. The same protocol as shown in figure 2A was used. Only currents recorded during the ramp are shown. For comparison, currents were normalized to the maximum peak current during the ramp and plotted against the command voltage. The dotted lines indicate the potential where the currents peaked (‘peak potential’) and are also used to indicate the isoform ratio (in % of hERG1b abundance). B, Summary data of the variation in ‘peak potential’. For comparison, the peak amplitude was normalized to N and plotted as a function of the ‘peak potential’. Image published in: Larsen AP and Olesen SP (2010) Larsen, Olesen. Creative Commons Attribution license Larger Image Printer Friendly View |