XB-IMG-118301
Xenbase Image ID: 118301
|
|
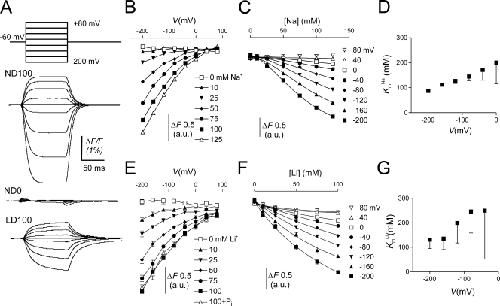
Figure 4. Cation dependency of the voltage-dependent fluorescence in oocytes expressing S448C. (A) Original fluorescence trace recorded in ND100 (top), ND0 (middle), and LD100 (bottom) solutions from an oocyte labeled with MTS-TMR. The membrane voltage was stepped from Vh = −60 mV to voltages ranging between −200 and +80 mV in 40-mV increments as indicated. ΔF signals were lowpass filtered at 70 Hz (note that in these traces the relaxations are significantly distorted by the filter). (B) Na+ dependency of the voltage-dependent fluorescence (ΔF). Steady-state fluorescence at different membrane potentials was acquired for each Na+ concentration indicated on the figure. Data points are joined for visualization only. (C) Data in B were replotted as a function of the Na+ concentration and fitted with Eq. 4 (solid lines). (D) KmNa as reported by the fit of Eq. 4 to the data in C. For the initial fit we obtained H = 1.8 ± 0.02, and then refit the data with H constrained to 1.8 to reduce the fitting error associated with KmNa. (E) Li+ dependency of the voltage-dependent fluorescence (ΔF). Steady-state fluorescence at different membrane potentials was acquired for each Li+ concentration indicated in the figure. In addition, data were acquired with 1 mM Pi in 100 mM Li+. Symbols are joined for visualization only. (F) Data in E were replotted as a function of the Li+ concentration and fitted with Eq. 4 (solid lines). (G) KmLi as reported by the fit of Eq. 4 (H constrained to 1) to the data in F. Image published in: Virkki LV et al. (2006) Copyright © 2006, The Rockefeller University Press. Creative Commons Attribution-NonCommercial-ShareAlike license Larger Image Printer Friendly View |