XB-IMG-126406
Xenbase Image ID: 126406

|
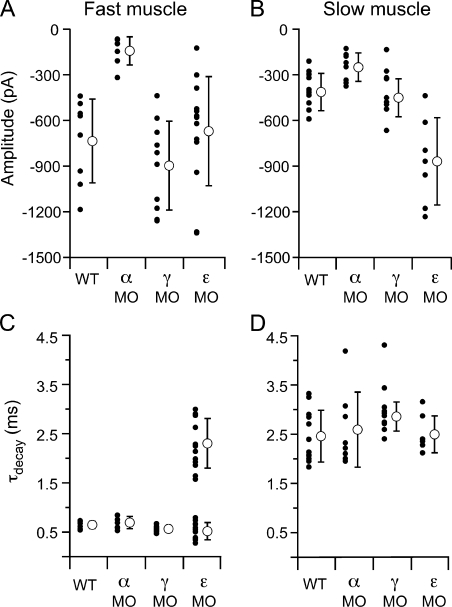
Figure 10. Comparison of synaptic current properties after α, γ, and ε AChR subunit knockdown in fast and slow muscle. All recordings were performed at a −70 mV holding potential. (A) Mean amplitude of spontaneous synaptic currents recorded from fast muscle for individual cells (filled circles) and overall mean ± SD (open circles) for each condition. (B) Mean amplitude of spontaneous synaptic currents recorded from slow muscle for individual cells (filled circles) and overall mean ± SD (open circles) for each condition. (C) Mean τdecay values for individual fast muscle recordings (filled circles) and overall mean ± SD (open circles) for each condition. (D) Mean τdecay values for individual slow muscle recordings (filled circles) and overall mean ± SD (open circles) for each condition. Image published in: Mongeon R et al. (2011) © 2011 Mongeon et al. Creative Commons Attribution-NonCommercial-ShareAlike license Larger Image Printer Friendly View |
