XB-IMG-128066
Xenbase Image ID: 128066
|
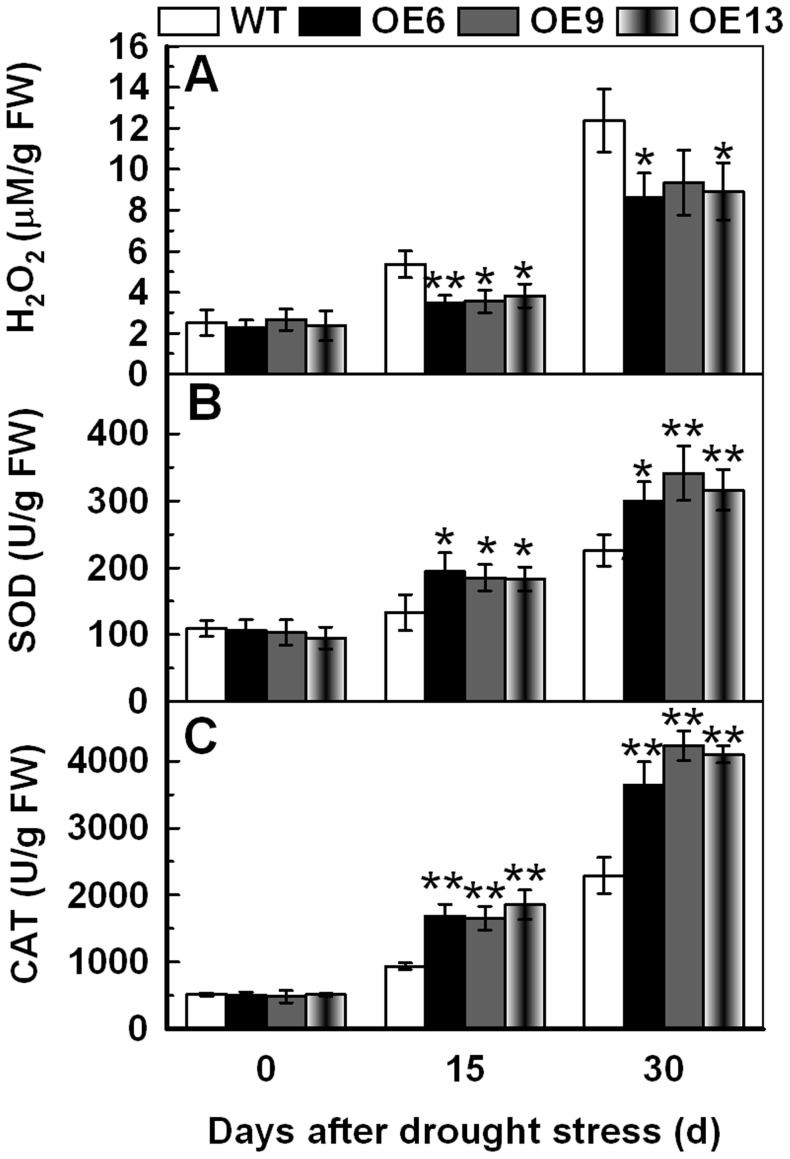
Figure 7. Analysis of H2O2 content, SOD and CAT activities in transgenic lines under drought stress.The WT and transgenic lines were cultured in MS medium under a 16 h light/8 h dark cycle at 25°C for one week, and then the plants were transplanted to containers filled with a mixture of soil and sand (3∶1) where they were regularly watered for two weeks. Three-week-old tobacco plants were deprived of water for 30 d. Tobacco leaves were sampled from WT and transgenic lines under drought stress for 15 d and 30 d to detect H2O2 content (A), SOD (B) and CAT (C) activities. Vertical bars indicate ±SD calculated from four replicates. Asterisks indicate significant difference between the WT and the three transgenic lines (*p<0.05; **p<0.01). Three biological experiments were performed, which produced similar results. Image published in: Zhou S et al. (2012) Image reproduced on Xenbase with permission of the publisher and the copyright holder. Creative Commons Attribution license Larger Image Printer Friendly View |