XB-IMG-124209
Xenbase Image ID: 124209
|
|
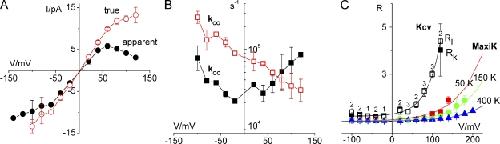
Figure 5. Voltage dependence of fast gating. (A) I-V curves of Iapp (filled black circles) obtained from the time series directly by averaging over the bursts, and Itrue (open red circles) evaluated from the β distribution fits. (B) Voltage dependence of kOC (filled black squares) and kCO (open red squares). (C) The gating factor R obtained from Kcv at 100 mM KCl and from MaxiK obtained at 50, 150, and 400 mM KCl. For Kcv, RI and RK are both displayed (open squares and filled squares, respectively); for MaxiK, only RI is displayed. The smooth lines approximating the data points present the exponential fits by means of Eq. 3. Parameters for Kcv: R0 = 1.2 ± 0.1 mV, VG = 34 ± 3 mV, and RK = 11 ± 3. Numbers of individual experiments are given for Kcv. Image published in: Abenavoli A et al. (2009) © 2009 Abenavoli et al. Creative Commons Attribution-NonCommercial-ShareAlike license Larger Image Printer Friendly View |