XB-IMG-171207
Xenbase Image ID: 171207

|
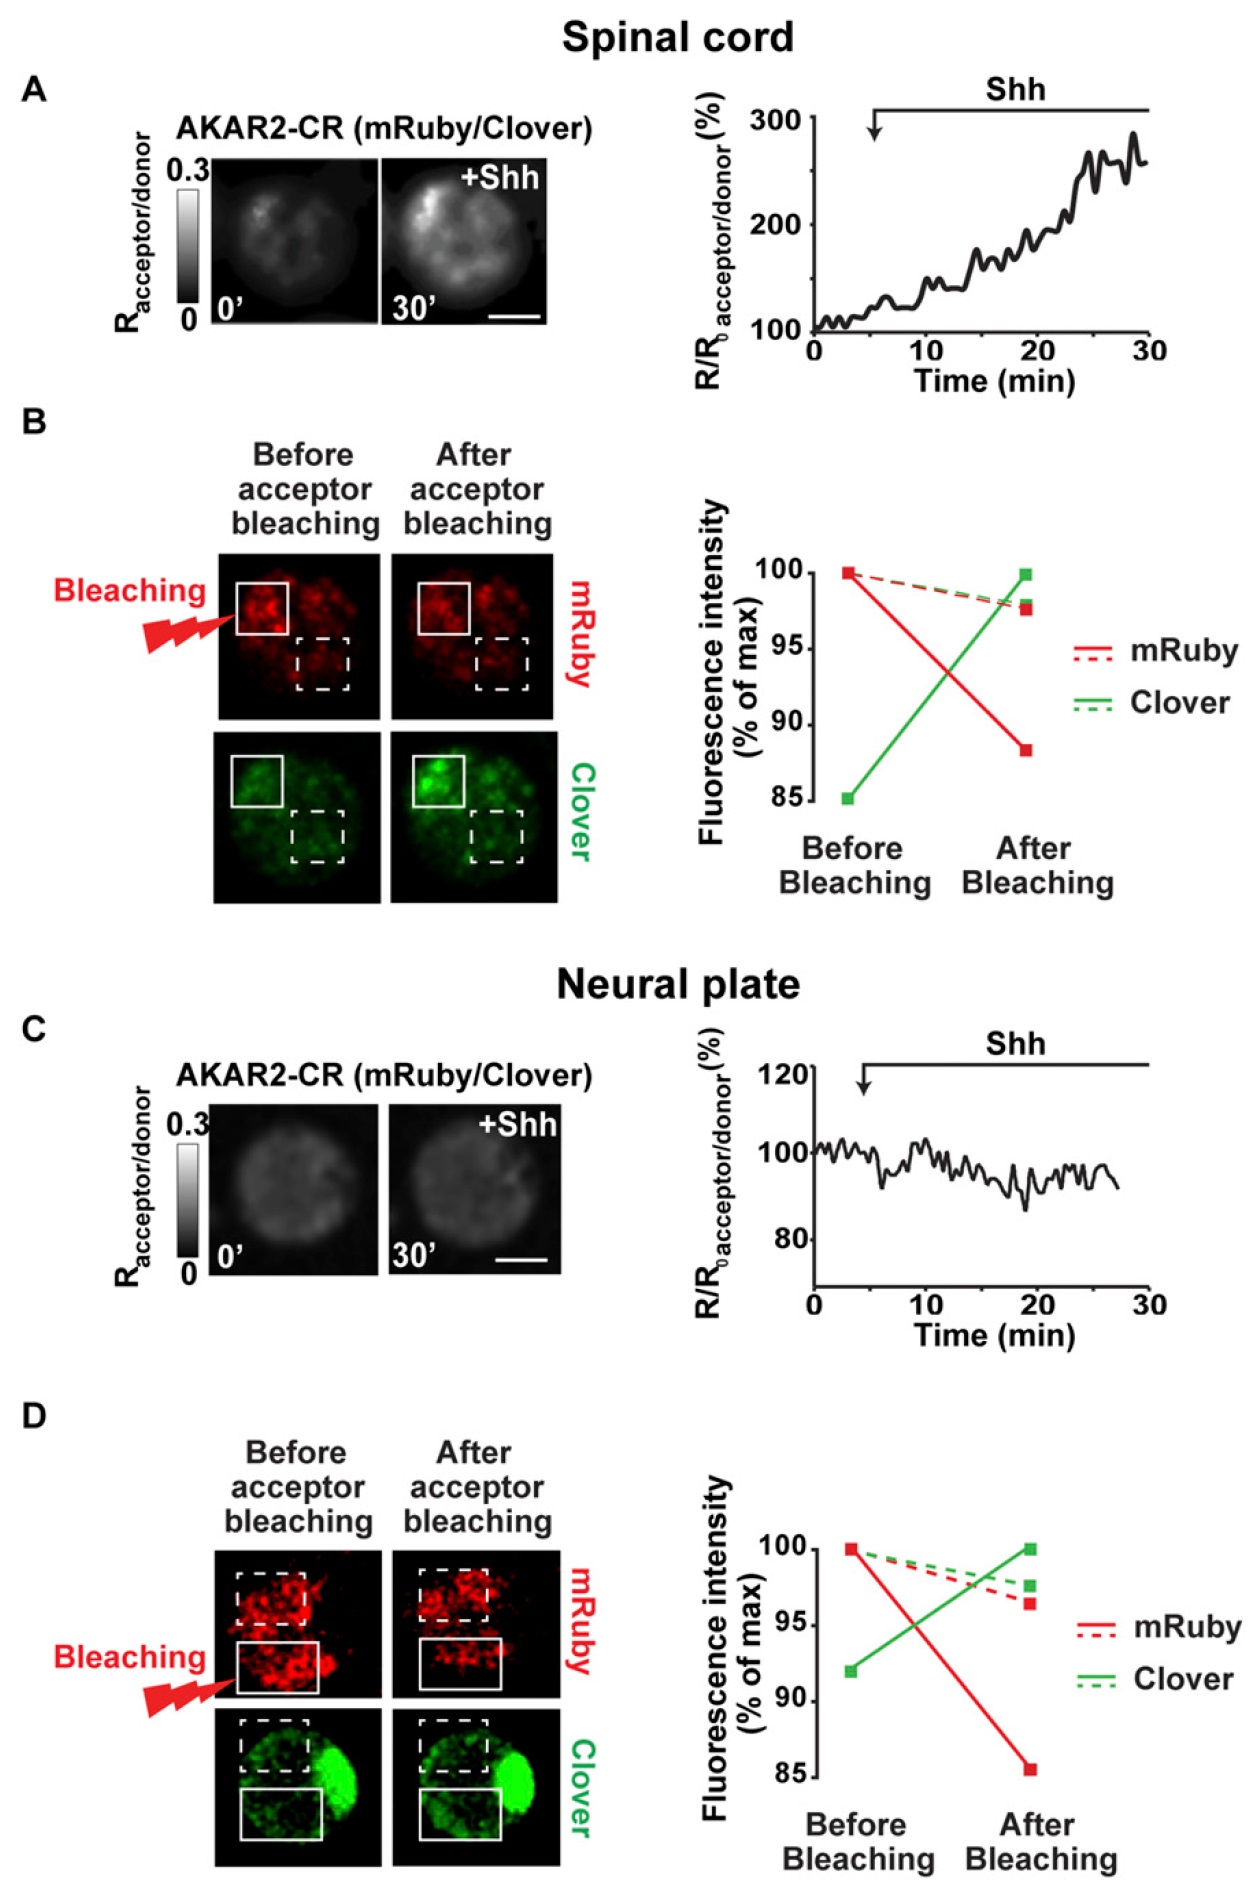
Fig. S3. FRET specificity of PKA reporter. (A and C) Dissociated spinal cord (A) or neural plate (C) cells from AKAR2-CR–expressing 21- or 14.75-hpf embryos,
respectively, were time-lapse imaged every 30 s. Samples are illuminated with 488-nm laser and mRuby and Clover emitted fluorescence captured with spectral
detector. (Left) Representative ratiometric (acceptor-mRuby/donor-Clover) images of cell before and 30 min after addition of 10 nM Shh. Grayscale bar
represents acceptor/donor ratio increasing from black to white. (Right) Data are percentage change in emission ratio for cell on the Left. (Scale bar: 20 μm.) (B
and D) FRET specificity is assessed by quantifying acceptor and donor emission fluorescence using a 488-nm laser before and after acceptor (mRuby) photobleaching.
Shown is same cell as in A and C subjected to the positive control for FRET specificity before (Left) and after (Right) acceptor photobleaching using
a 580-nm laser in indicated region of interest (ROI; solid line). Negative control is a random nonbleached ROI (dashed line). Graph represents average fluorescence
intensity in indicated ROIs from mRuby (red lines) and Clover (green lines) emissions. Donor signal is increased only when acceptor is photobleached
(compare solid and dashed lines), demonstrating FRET between Clover and mRuby. This protocol has been repeated in at least three cells in each imaged field.
(Scale bar: 10 μm.) Image published in: Belgacem YH and Borodinsky LN (2015) Copyright © 2015. Image reproduced with permission of the Publisher and the copyright holder. This is an Open Access article distributed under the terms of the Creative Commons Attribution License. Larger Image Printer Friendly View |
