XB-IMG-120956
Xenbase Image ID: 120956
|
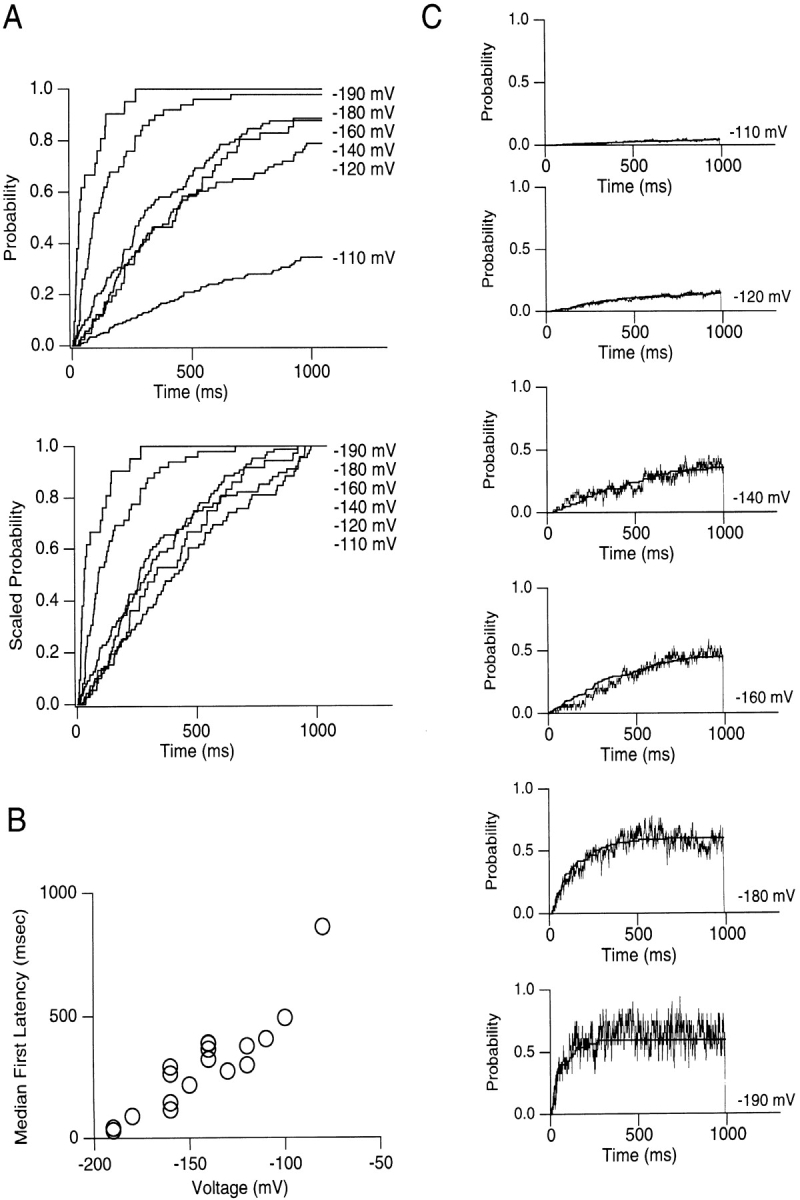
Figure 3. (A) Cumulative distributions of first latencies recorded at several voltages. The distributions show the probabilities that the channel first opened by the times indicated. The openings were elicited in response to 1,000-ms pulses from a prepulse potential of −40 mV. (Bottom) The cumulative first latency distributions have been scaled to a probability of 1 to compare their time courses. (B) Median first latencies measured from the distributions in A and several additional patches are plotted as a function of pulse potential. Several different patches are represented among the data points. (C) The cumulative first latency distributions are superimposed on the ensemble averages from the same patch at each voltage indicated. The thin, relatively noisy lines represent the ensemble averages, and the thick, smoother lines represent the first latency distributions. The curves are scaled so that the steady state levels coincide. Image published in: Zei PC and Aldrich RW (1998) Image reproduced on Xenbase with permission of the publisher and the copyright holder. Creative Commons Attribution-NonCommercial-ShareAlike license Larger Image Printer Friendly View |