XB-IMG-128963
Xenbase Image ID: 128963
|
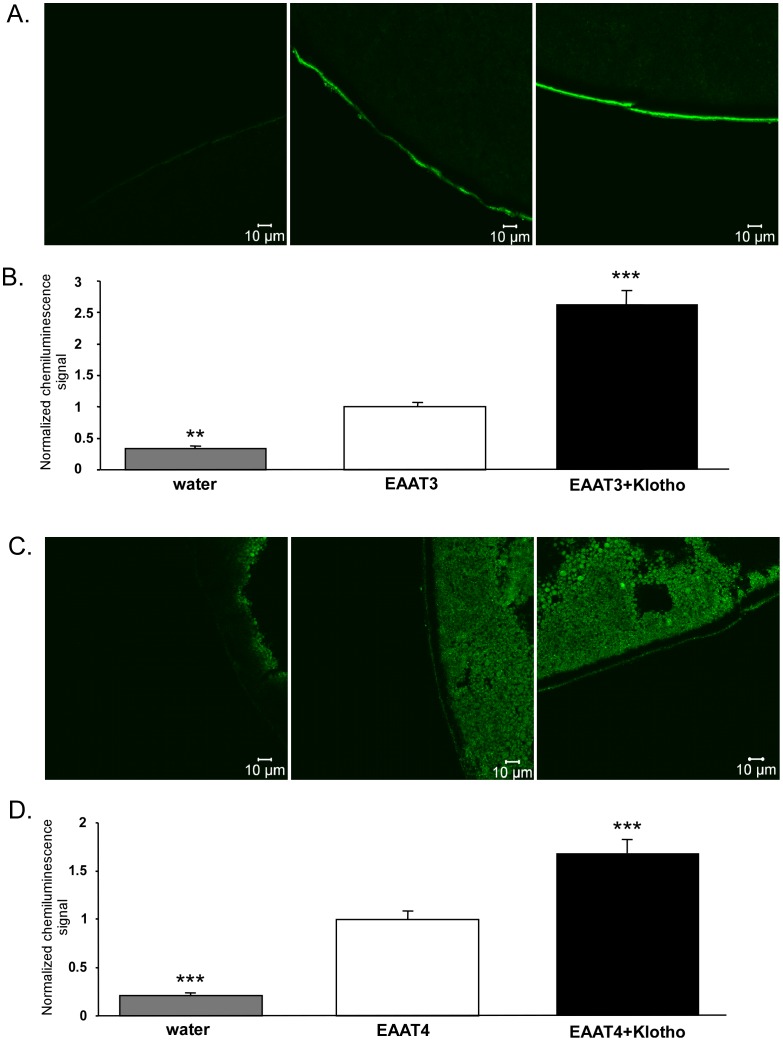
Figure 3. Effect of Klotho coexpression on protein abundance of both EAAT3 and EAAT4 in the Xenopus oocyte cell membrane.A, C: Confocal images of EAAT3 (A) and EAAT4 (C) protein abundance in the plasma membrane of Xenopus oocytes injected with water (1st panel), injected with cRNA encoding EAAT3 (A) or EAAT4 (C) without (2nd panel) or with additional coexpression of Klotho (3rd panel). B, D: Means ± SEM of EAAT3 (B, n = 75–80) and EAAT4 (D, n = 82–87) protein abundance as determined by chemiluminescence in the plasma membrane of Xenopus oocytes injected with cRNA encoding EAAT3 (B) or EAAT4 (D) without (white bars) or with (black bars) coexpression of Klotho. For comparison, water injected oocytes (grey bars).**,***(p<0.01, p<0.001) indicate statistically significant difference from Xenopus oocytes injected with cRNA encoding EAAT3/EAAT4 alone (ANOVA). Image published in: Almilaji A et al. (2013) Image reproduced on Xenbase with permission of the publisher and the copyright holder. Creative Commons Attribution license Larger Image Printer Friendly View |