XB-IMG-126713
Xenbase Image ID: 126713
|
|
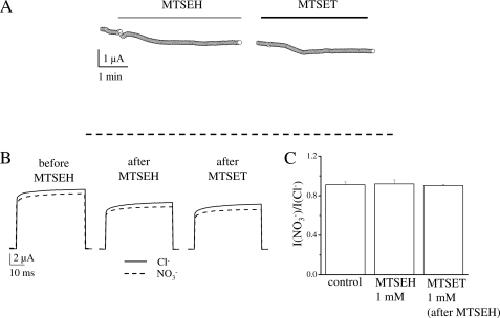
FIGURE 7. MTSEH modification of K210C. A, representative current recordings showing the effect of 1 mm MTSEH on the stationary current level followed by application of 1 mm MTSET. Both reagents were dissolved in measuring solution containing 100 mm NO3−. Application of MTSEH is indicated by a gray bar and application of MTSET by a black bar. After MTSEH application the experiment was interrupted to record I-V relationships in Cl− and NO3− solutions. The dashed line represents the 0 current level. B, representative current recordings in Cl− (solid trace) and NO3− (dashed trace), at 100 mV from the same oocyte shown in panel A (before and after MTSEH application and after application of MTSET). In these conditions the value of INO3−/ICl− was, respectively, 0.91, 0.91, and 0.88. C, average value of INO3−/ICl− before and after MTSEH application (n = 6) and after application of MTSET (n = 3). The differences of the values of INO3−/ICl− in these three different conditions were not statistically significant (p > 0.8). Image published in: De Stefano S et al. (2011) © 2011 by The American Society for Biochemistry and Molecular Biology, Inc. Creative Commons Attribution-NonCommercial license Larger Image Printer Friendly View |