XB-IMG-169183
Xenbase Image ID: 169183
|
|
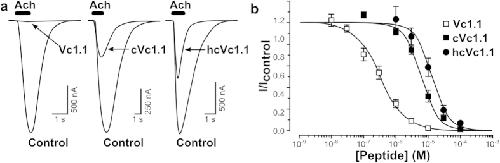
Figure 4. Activity of hcVc1.1 at the α9α10 nAChR.(a,b). (a) Superimposed representative traces of ACh (10 μM)-evoked inward currents obtained in the absence (control) and presence of 1 μM Vc1.1, cVc1.1 and hcVc1.1 applied to hα9α10 nAChRs expressed in oocytes. (b) Concentration-response curves for inhibition of hα9α10 currents by Vc1.1, cVc1.1 and hcVc1.1. Data points represent relative peak current amplitudes (I/Icontrol), mean ± SEM; n = 3–7. IC50 values obtained for Vc1.1, cVc1.1 and hcVc1.1 are 320 nM, 6 μM and 13 μM, respectively. Image published in: Yu R et al. (2015) Copyright © 2015, Macmillan Publishers Limited. Creative Commons Attribution license Larger Image Printer Friendly View |