XB-IMG-125568
Xenbase Image ID: 125568
|
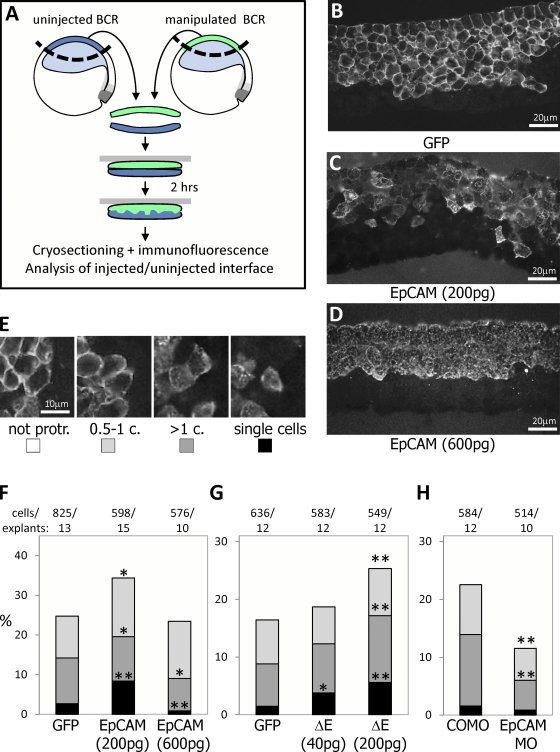
Figure 4. EpCAM stimulates cell migration within the ectodermal tissue. (A) Schematic representation of a migration assay in ectoderm explants. Sandwiches were produced by combining wild-type uninjected BCRs with BCRs injected with various mRNAs coding for membrane GFP, EpCAM-MT (see Fig. S2) or ΔE, or with EpCAM MO or COMO (coinjected with membrane GFP mRNA to trace injected cells). The degree of mixing was scored by determining the relative position of individual injected cells, immunostained for GFP or Myc, at the interface with wild-type cells. (B–D) Examples of sandwiches with BCRs expressing control membrane GFP, and low and high levels of EpCAM. (E) Illustration of the four categories used to score cell migration: cells protruding less than 1/2 cell diameter relative to their neighbors (nonprotr.), cells protruding between 1/2 and 1 diameter (0.5–1), or more than one cell diameter (>1), and cells entirely surrounded by wild-type cells (single cells). (F–H) Quantification. Cells moderately overexpressing EpCAM tended to migrate significantly more, whereas cells with high EpCAM levels remained more compacted. Cells expressing ΔE also showed increased migration, for both mRNA doses tested. On the contrary, cells depleted of EpCAM (EpCAM MO) remained significantly more compact. Numbers on top indicate total number of explants/number of experiments. * and **, P < 0.05 and P < 0.01, respectively, compared with controls (Student’s t test; see Materials and methods). Image published in: Maghzal N et al. (2010) © 2010 Maghzal et al. Creative Commons Attribution-NonCommercial-ShareAlike license Larger Image Printer Friendly View |