XB-IMG-125934
Xenbase Image ID: 125934
|
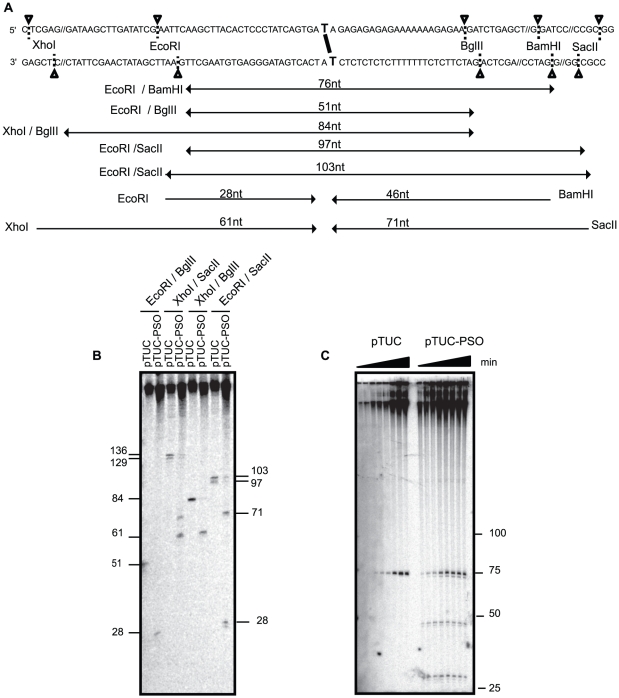
Figure 3. Replication fork leading strands progress up to the psoralen crosslink.(A) Sequence of the plasmid around the psoralen ICL with restriction sites used in B and C. Double arrows indicate the size of the replicated strands (lagging or leading) spanning the ICL site for the control or repaired plasmid. Single arrows indicate the progression of the leading strand to the ICL for the crosslinked plasmid. The strand size is shown above each product. (B) Mapping of leading strand progression for pTUC and pTUC-PSO after 65 min of incubation in Xenopus egg extracts in the continuous presence of [α-32P]-dATP. Plasmids were digested by the indicated enzymes and analyzed on 10% polyacrylamide denaturing gel. Faint bands visible in lanes 3 and 4 likely result from a star activity of Sac II. The two 28 nt size indicators are at two different positions due to gel smiling. (C) Mapping of leading strand progression for pTUC and pTUC-PSO at 25, 35, 50, 65, 85, 95, 120 and 180 min. Plasmids were digested with EcoRI and BamHI and subjected to migration on a 10% polyacrylamide denaturing gel. 28 nt and 46 nt fragments correspond to the DNA size expected for the leading strand arriving at the psoralen from the EcoRI side or BamHI side, respectively. Image published in: Le Breton C et al. (2011) Le Breton et al. Creative Commons Attribution license Larger Image Printer Friendly View |