XB-IMG-123718
Xenbase Image ID: 123718
|
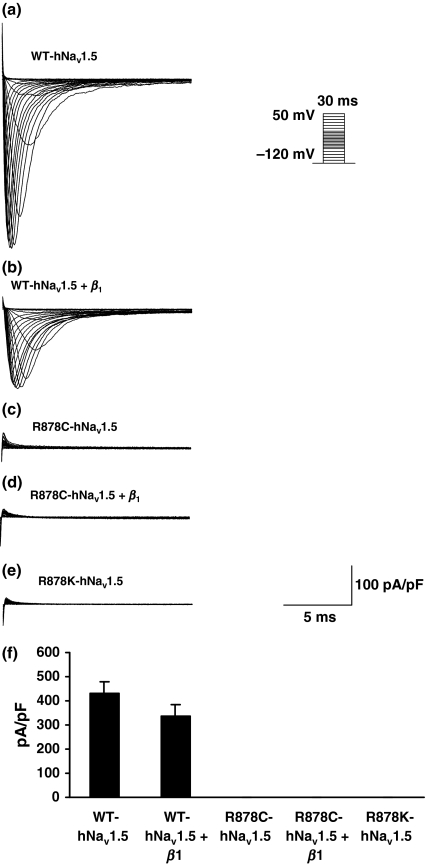
Figure 3. Characterization of iNa of WT and mutant channels in HEK293 cells. Inset: HEK293 ells were clamped at a holding potential of −120 mV and subjected to test voltage steps each lasting 30 ms that were made to membrane potentials between −110 and +50 mV in 5 or 10 mV increments and imposed at a pulsing frequency of 1.0 Hz. (a, b) WT-hNav1.5 and WT-hNav1.5 with β1 subunit. (c, d) Mutant R878C-hNav1.5 and mutant R878C-hNav1.5 with β1 subunit. (e) Substitution of R878K. (f) Bar graph summarizing peak iNa (pA pF−1) in each of the experimental situations above. Image published in: Zhang Y et al. (2008) © 2008 The Authors Journal compilation © 2008 Scandinavian Physiological Society. Creative Commons Attribution license Larger Image Printer Friendly View |