XB-IMG-121084
Xenbase Image ID: 121084
|
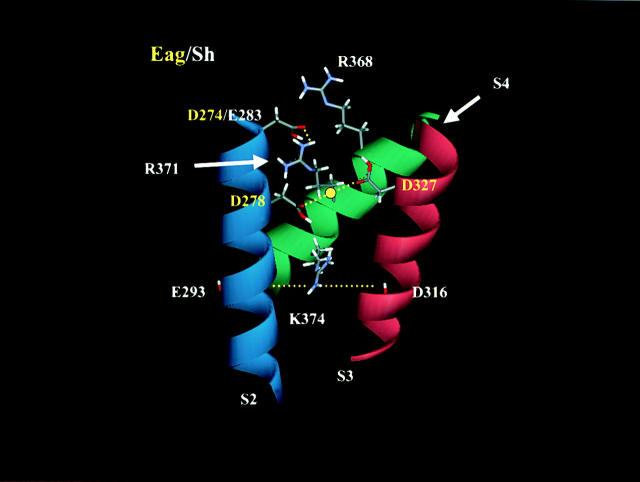
Figure 9. Model for the packing arrangement of transmembrane segments S2 (blue), S3 (red), and S4 (green) in the voltage sensor of K+ channels. The model contains structural constraints (dotted lines) inferred from characterization of the Mg2+-binding site in eag (this study) and from second site suppressor analysis of Shaker (Papazian et al. 1995; Tiwari-Woodruff et al. 1997). The transmembrane segments are shown in α-helical conformation with fully extended side chains. A yellow circle denotes a bound Mg2+ ion in eag. Side chains of pertinent residues have been labeled according to Shaker (white) and, in some cases, eag (yellow) numbering. Side chains of other residues are not shown. According to analysis of Shaker channels, the pictured conformation would represent the activated conformation of the voltage sensor (Tiwari-Woodruff et al. 2000). The model was generated using the programs InsightII and WebLab Viewer Lite (Molecular Simulations). Image published in: Silverman WR et al. (2000) © 2000 The Rockefeller University Press. Creative Commons Attribution-NonCommercial-ShareAlike license Larger Image Printer Friendly View |