XB-IMG-128405
Xenbase Image ID: 128405

|
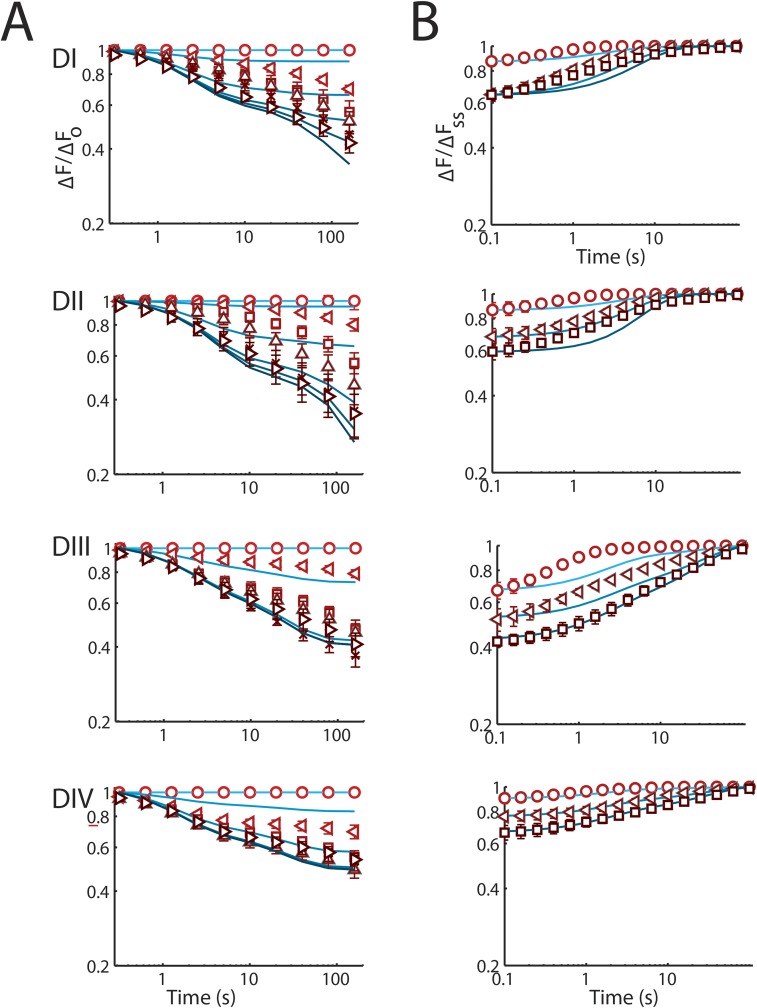
Figure 8. Models of voltage-sensor slow immobilization. Experimental data are shown with symbols, and models are represented by solid blue lines. The effect of the protocol was removed for model fitting by subtracting the minimal changes in voltage-sensor activation observed with pulses to −100 mV. For fitting, experimental recovery is scaled so that it begins recovering from exactly the same fraction where onset terminated. Ionic current recovery is simulated using the same parameters and models used to simulate ionic onset (Table 5). These simplified models are qualitatively similar to the inactivation of the voltage sensors. (A) Model voltage-sensor slow immobilization for all four domains. (B) Model voltage-sensor recovery from slow immobilization for all four domains. Image published in: Silva JR and Goldstein SA (2013) © 2013 Silva and Goldstein. Creative Commons Attribution-NonCommercial-ShareAlike license Larger Image Printer Friendly View |
