XB-IMG-120691
Xenbase Image ID: 120691
|
|
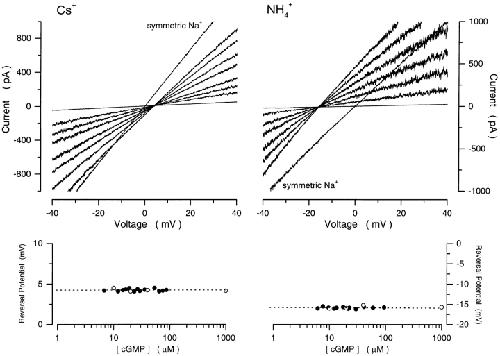
Figure 13. Cs+ and NH4+ selectivity of cGMP-gated channels in cone photoreceptors is independent of cGMP concentration. (Top left) I–V curves activated with a cGMP concentration ramp in the presence of biionic solutions: Cs+ (150)/Na+ (150). The cGMP concentration at the moment each I–V curve was measured were 0, 16.4, 23.2, 35.6, 40, 58, 87, and 1,000 μM. Also shown is the I–V curve activated by 1 mM cGMP in the same patch in the presence of symmetric Na+ solutions. (Bottom left) Reversal potential as a function of [cGMP]. (•) Reversal potentials measured from the data shown on top, (○) data measured in the same patch with steps of cGMP concentrations (10, 20, 40, and 1,000 μM). The dashed line is the mean of these values, 4.3 mV, which yields PCs/ PNa = 0.84. (Top right) I–V curves measured with a cGMP concentration ramp in the presence of biionic NH4+ (150)/Na+ (150) solutions. The cGMP concentrations at the moment of each I–V curve were 0, 17.6, 22.7, 40, 47, 93.9, and 1,000. Also shown is the I–V curve activated by 1,000 μM cGMP in the same patch in the presence of symmetric Na+ solutions. (Bottom right) Reversal potential as a function of [cGMP]. (•) Reversal potentials measured from the data on top, (○) data measured in the same patch with steps of cGMP concentrations (10, 20, 40, and 1,000 μM). The dashed line is the mean of these values, −15.8 mV, which yields PNH4/PNa = 1.89. Image published in: Hackos DH and Korenbrot JI (1999) Image reproduced on Xenbase with permission of the publisher and the copyright holder. Creative Commons Attribution-NonCommercial-ShareAlike license Larger Image Printer Friendly View |