XB-IMG-128876
Xenbase Image ID: 128876
|
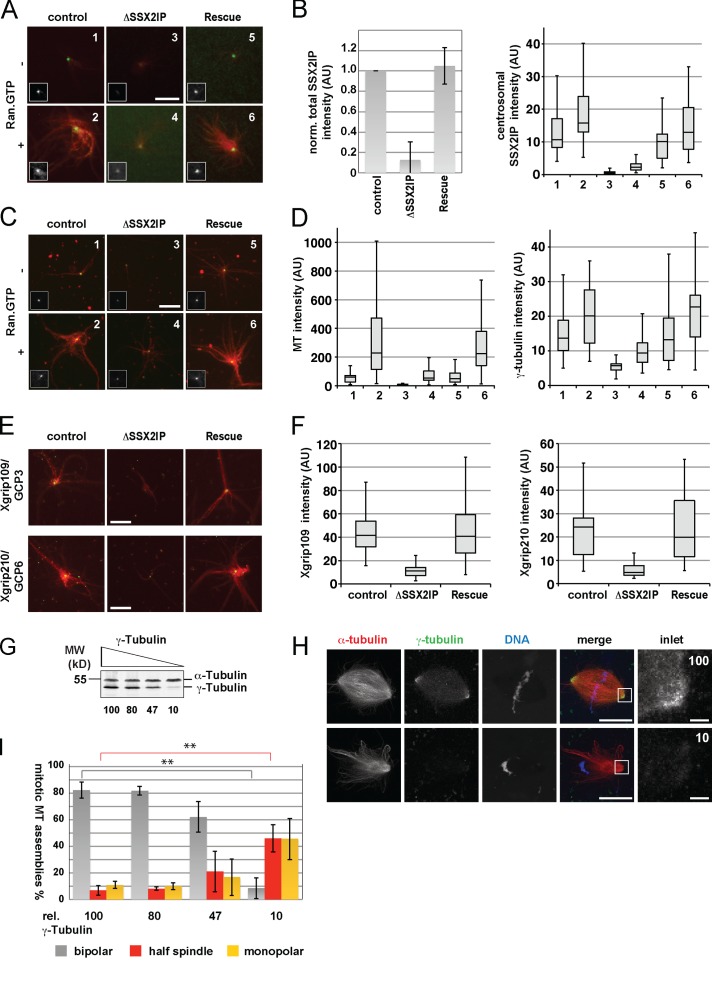
Figure 4. SSX2IP is required for mitotic centrosome maturation. (A) Localization of SSX2IP on centrosomes. Extracts were incubated with centrosomes and labeled tubulin (red) in the presence or absence of RanGTP. A labeled SSX2IP antibody (green) was added 5 min before squash fixation on coverslips. Note that the RanGTP-dependent centrosome maturation assay was done in TPX2-depleted extracts that do not nucleate self-organized MTs but leave MT nucleation exclusively to centrosomal asters. Insets of the same scale as the images highlight SSX2IP on centrosomes. (B, left) SSX2IP total levels in control, depleted, and reconstituted extracts were quantified by immunoblotting from three independent experiments. (B, right) SSX2IP levels on centrosomes were assayed and quantified as described previously (Yokoyama et al., 2008). (C and E) Samples as in A were fixed after aster assembly, spun down on coverslips, and stained with γ-tubulin antibodies (C, green) or Xgrip109/GCP3 or Xgrip210/GCP6 antibodies (E, green). Insets in C of the same scale as the images highlight γ-tubulin on centrosomes. (D and F) MT intensity and γ-tubulin (D) or Xgrip109 and Xgrip210 (F) levels in centrosomal asters were quantified as described previously (Yokoyama et al., 2008). (G) γ-TuRC levels were reduced in X. laevis egg extracts by immunodepletion using an antibody against γ-tubulin (Zheng et al., 1995); numbers indicate relative γ-tubulin levels. (H) Representative images from bipolar spindles in control (100% γ-TuRC levels) and half-spindles after removing 90% γ-TuRC (10% residual levels). Red, α-tubulin; green, γ-tubulin; blue, DAPI/DNA. Insets show γ-tubulin signals. (I) Mitotic MT assemblies after removing γ-TuRC were analyzed. n > 80 structures counted in all samples; graph shows mean ± SD from three independent experiments. The significance (100 vs. 10% γ-tubulin) was calculated by a Student’s t test (two-tailed) and scored as **, P < 0.01. Bars: (main panels) 20 µm; (magnified regions indicated by white boxes) 2 µm. Image published in: Bärenz F et al. (2013) © 2013 Bärenz et al. Creative Commons Attribution-NonCommercial-ShareAlike license Larger Image Printer Friendly View |