XB-IMG-126230
Xenbase Image ID: 126230

|
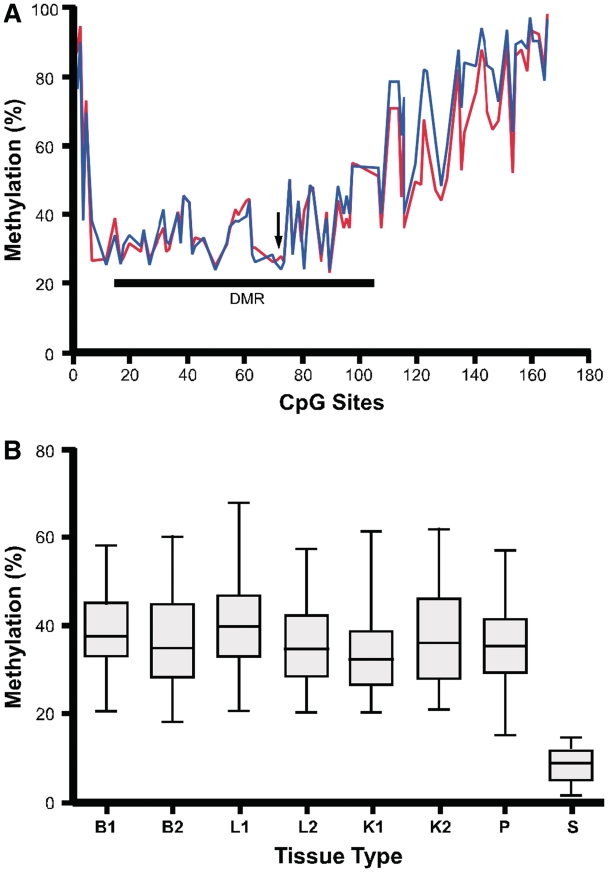
Figure 2. CpG methylation status at the FAM50B locus. (A) The percent methylation of CpG sites 1–166 was quantified by Sequenom MassARRAY using DNA from conceptus liver (blue line, n = 3) and brain (red line, n = 3). CpG site numbers correspond to the positions within the GC rich region (−1353 to +1066 relative to the FAM50B translational start codon). Arrow indicates the position of the translational start codon. The location of a DMR is shown by a horizontal line. (B) Average methylation of CpG sites (12 to 110) does not vary significantly for conceptus tissues from the three germ layers and from different gestational ages, while sperm shows low levels of methylation at this locus. B, brain; L, liver; K, kidney; P, placenta; S, sperm; B1, L1 and K1—gestational age of 81 days; B2, L2 and K2—gestational age of 110 days. Image published in: Zhang A et al. (2011) © The Author(s) 2011. Creative Commons Attribution-NonCommercial license Larger Image Printer Friendly View |
