XB-IMG-126228
Xenbase Image ID: 126228

|
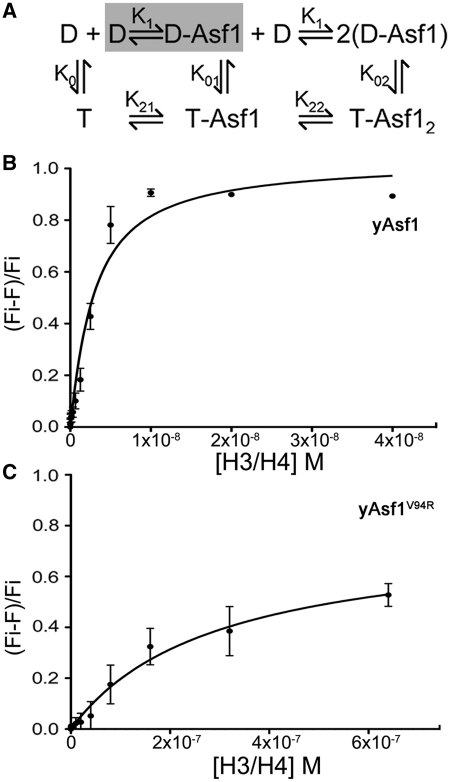
Figure 5. Affinity of Asf1 and H3/H4 determined by fluorescence quenching. (A) Schematic diagram of model equilibria for yAsf1 association with H3/H4 complexes. D and T indicate H3/H4 dimers and tetramers, respectively. (B) H3/H4*Qsy9 binding to yAsf1* was observed by fluorescence quenching. H3/H4*Qsy9 was titrated into 1.0 nM yAsf1*. The data were fitted with a ligand-depleted binding model (Equation 1; GraphPad Prism) because the concentration of yAsf1* was within 10-fold of the Kd value. (C) H3/H4*Qsy9 binding to yAsf1*V94R was observed by fluorescence quenching. H3/H4*Qsy9 was titrated into 1.0 nM yAsf1*V94R. The curve was fitted (GraphPad Prism) with a Langmuir single-site binding isotherm. Image published in: Donham DC et al. (2011) © The Author(s) 2011. Creative Commons Attribution-NonCommercial license Larger Image Printer Friendly View |
