XB-IMG-124761
Xenbase Image ID: 124761
|
|
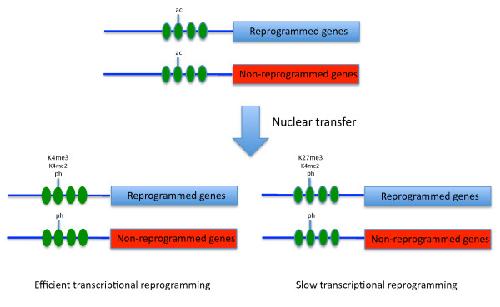
Figure 7. Schematic illustration of histone modification changes during transcriptional reprogramming in mouse somatic cell nuclei transplanted to Xenopus germinal vesicles. A green oval represents nucleosomes. Horizontal blue bars represent DNA in promoter regions. Blue bars represent genes that are reprogrammed, such as Sox2 or Oct4. Red bars represent genes that are not reprogrammed, such as β-globin. Short vertical bars representing histone tails and modifications that take place in each condition are shown above the tails. ac indicates various histone acetylations; ph indicates various histone phosphorylations; K4 me2 indicates H3K4 me2; K4 me3 indicates H3K4 me3; and K27 me3 indicates H3K27 me3. Image published in: Murata K et al. (2010) Copyright ©2010 Murata et al; licensee BioMed Central Ltd. Creative Commons Attribution license Larger Image Printer Friendly View |