XB-IMG-116238
Xenbase Image ID: 116238
|
|
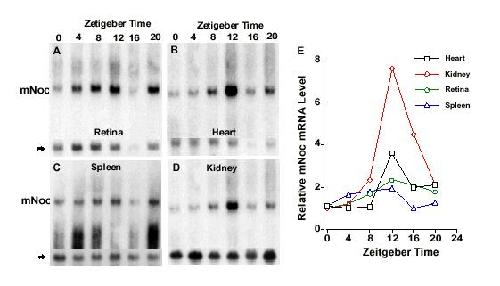
Figure 5. mNoc mRNA is expressed rhythmically in C3H/He mouse retina (A), heart (B), spleen (C), and kidney (D) in constant darkness (DD). Tissues for RNA extraction were taken in DD at Zeitgeber Times (ZT) 0 (24), 4, 8, 12, 16 and 20 referenced to the LD cycle immediately before DD treatment. Mice were in DD for 36 hours before beginning collections. Note that for most tissues the RNA yield was low at ZT16 for technical reasons; the lower actin signal is taken into account in the quantitation. The rhythmic changes illustrated are representative of two replicate experiments. In E, phosphor imaging was used for quantitation of the changes seen in A-D, standardized to β-actin; the minimum for each plot is one and the Y-axis shows the fold change. Image published in: Wang Y et al. (2001) Image downloaded from an Open Access article in PubMed Central. Copyright © 2001 Wang et al; licensee BioMed Central Ltd. This is an Open Access article: verbatim copying and redistribution of this article are permitted in all media for any purpose, provided this notice is preserved along with the article's original URL. Larger Image Printer Friendly View |