XB-IMG-123467
Xenbase Image ID: 123467
|
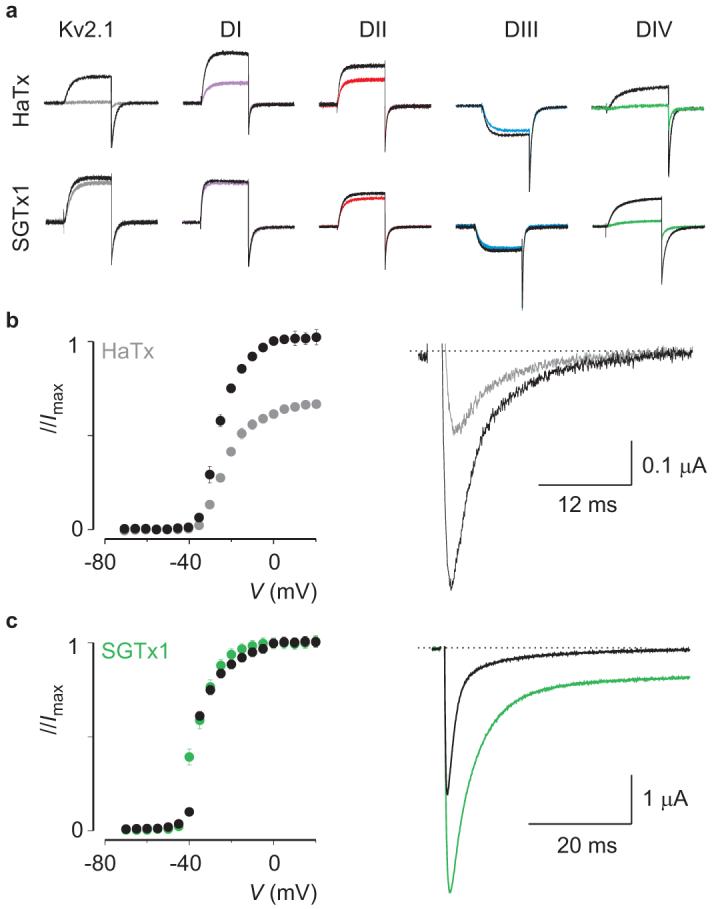
Figure 6. Identifying a tarantula toxin selective for the paddle motif in domain IVa, Potassium currents elicited by depolarizations near the foot of the voltage-activation curve for Kv2.1 and chimaeras in the absence and presence of 50nM HaTx or 100nM SGTx1. The holding voltage was -90mV, test pulse duration was 300 ms, and the tail voltage was -50mV (-80mV for DIII). b, Conductance-voltage relationships for rNav1.2a before and after addition of 50nM HaTx (left), normalized to the maximal conductance in control. Sodium current elicited by a depolarization to -30 mV before and after addition of 50nM HaTx (right). c, Conductance-voltage relationship of rNav1.2a before and after addition of 100nM SGTx1 (left), individually normalized to the maximal conductance in either control or the presence of toxin. Sodium current elicited by a depolarization to -15 mV before and after addition of 100nM SGTx1 (right). n = 3-5 for each toxin concentration and error bars represent s.e.m (b, c). Image published in: Bosmans F et al. (2008) Image downloaded from an Open Access article in PubMed Central. Image reproduced on Xenbase with permission of the publisher and the copyright holder. Larger Image Printer Friendly View |