XB-IMG-127428
Xenbase Image ID: 127428
|
|
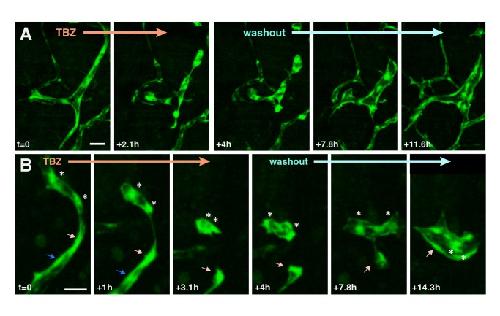
Figure 6. After disassembly of the vasculature by TBZ, washout of the drug leads to partial recovery of the vascular network.Two time series are shown in (A) and (B), imaged as in Figure 5. Following washout, cells dissociated by TBZ treatment recommence cell elongation and connection. Individual cells are indicated by arrows/asterisks. Scale bar in (A), 50 µm; in (B), 40 µm. Image published in: Cha HJ et al. (2012) Image reproduced on Xenbase with permission of the publisher and the copyright holder. Creative Commons Attribution license Larger Image Printer Friendly View |