XB-IMG-123495
Xenbase Image ID: 123495

|
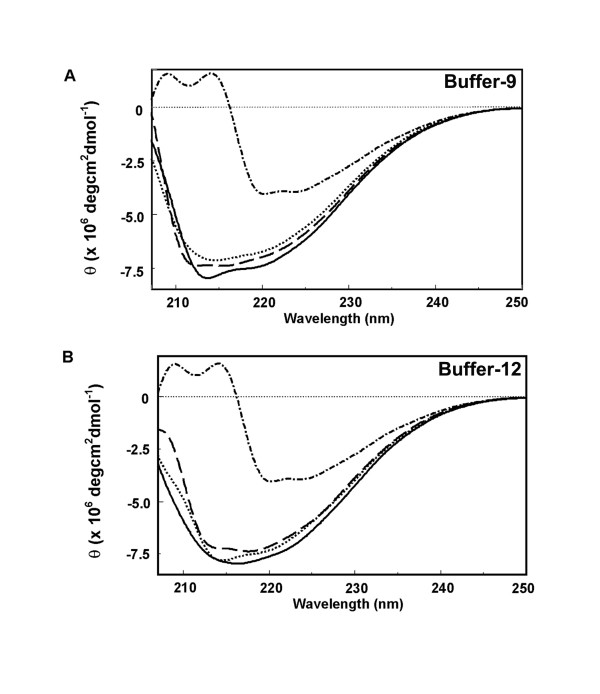
Figure 2. Representative CD spectra of soluble 6 × His-ATD2B proteins in the presence and absence of ligands at 25°C. A. Buffer -9 refolded protein; B. Buffer -12 refolded protein; Solid line, protein in absence of ligand; Dotted line, in presence of 5 μM ifenprodil; Dashed line, in presence of 0.5 μM RO25,6981; Dashed-dotted line, 4 M Gdn.HCl-denatured protein. Y-axis represents the molecular ellipticity. X-axis represents the range of wavelengths analyzed. Image published in: Ng FM et al. (2008) Copyright © 2008 Ng et al; licensee BioMed Central Ltd. Creative Commons Attribution license Larger Image Printer Friendly View |
