XB-IMG-122429
Xenbase Image ID: 122429
|
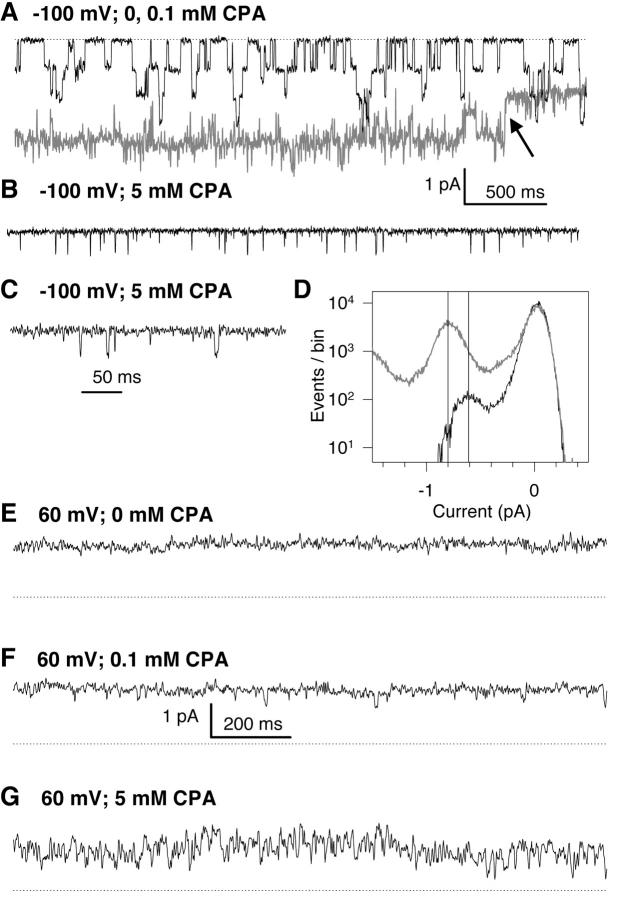
Figure 6. . Recordings from a patch with only a few channels. Representative traces from a single patch held at −100 mV (A–C) or 60 mV (E–G) in the absence of CPA (gray trace in A and E), with 0.1 mM CPA (black trace in A and F), or 5 mM CPA (B, C, and G) are shown. In C a short stretch of the trace in B is shown at a higher time-resolution (filtered at 500 Hz, while the longer traces were filtered at 200 Hz before display). In D a raw amplitude histogram of the recording at −100 mV in the presence of 0.1 mM CPA (gray trace) and 5 mM CPA (black trace) is shown. The vertical lines are drawn at current values of −0.8 and −0.61 pA to highlight the first nonzero peaks of the respective amplitude histograms. The bin-width for the amplitude histograms was 5 fA. The vertical scale bar in A also applies to B and C, and the scale bars in F also apply to E and G. The patch most likely contained two channels with four pores. Similar results were obtained in a total of four patches. Image published in: Traverso S et al. (2003) Copyright © 2003, The Rockefeller University Press. Creative Commons Attribution-NonCommercial-ShareAlike license Larger Image Printer Friendly View |