XB-IMG-175694
Xenbase Image ID: 175694

|
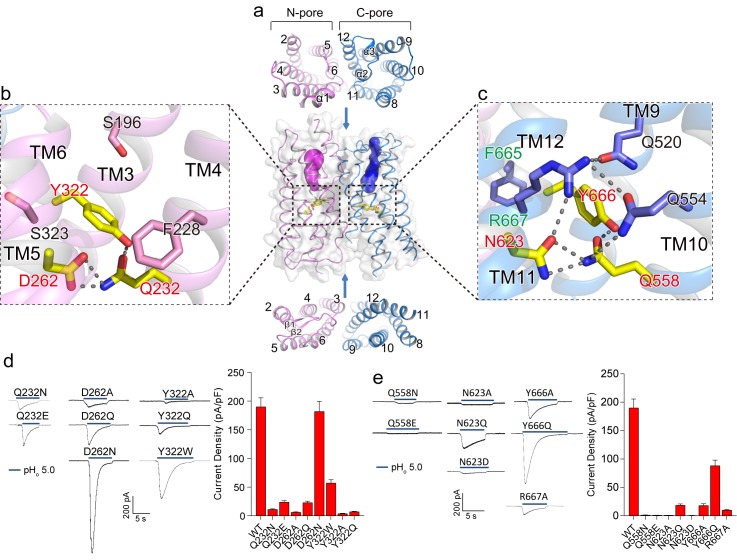
Figure 3. Putative proton conduction pores.(a) The surface-rendered XtOTOP3 structure shows two solvent accessible openings (magenta and blue) from the extracellular side. Upper and lower insets show membrane-spanning barrels viewed from the extracellular and intracellular side, respectively. (b) Zoomed-in view of the Gln-Asp-Tyr constriction triad (yellow) and surrounding residues (pink) in the N-pore. Hydrogen-bonds are shown as dashed lines. (c) Zoomed-in view of the Gln-Asn-Tyr constriction triad (yellow) and surrounding residues (blue) in the C-pore. Dashed lines mark the hydrogen-bonding network. (d) Sample traces of whole-cell currents of the N-pore triad mutants measured at −100 mV (left) and their current densities (right). The currents were elicited by changing pHo from 7.4 to 5.0 with pHi = 7.4. (e) Sample traces of the C-pore triad mutants (left) and their current densities (right) using the same recording conditions as d. Data in d and e are shown as mean ± s.e.m. (n = 5 independent experiments).
10.7554/eLife.46710.012Figure 3—source data 1. Source data for Figure 3d and e Image published in: Chen Q et al. (2019) © 2019, Chen et al. Creative Commons Attribution license Larger Image Printer Friendly View |
