XB-IMG-128905
Xenbase Image ID: 128905
|
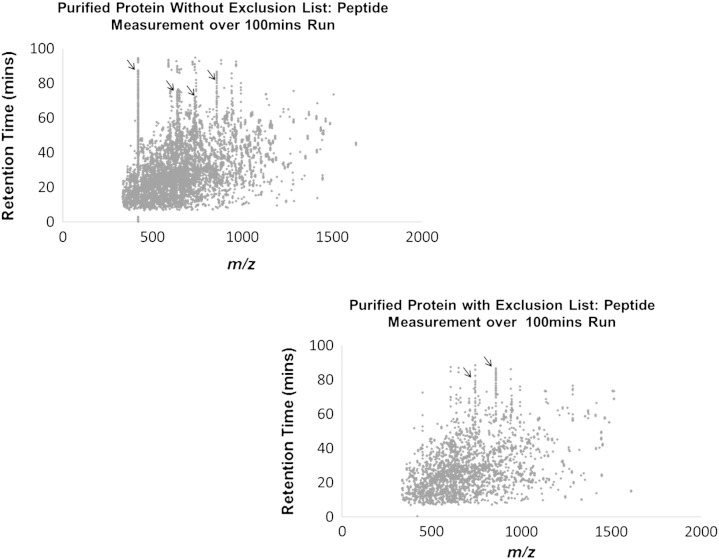
Fig. 6. Purified protein samples run with and without the exclusion list. m/z values were plotted against the retention time. The ‘lines’ of contaminant peptide masses were apparent and these reduced in frequency when samples were run with the exclusion list. The loss of data upon use of the exclusion list is clearly visible in the lower right graph, which undermines the value of the exclusion list approach when analysing low complexity samples. See supplementary Fig. 6 for technical replicate graphs. Image published in: Hodge K et al. (2013) © 2013 Elsevier B. Creative Commons Attribution license Larger Image Printer Friendly View |