XB-IMG-127518
Xenbase Image ID: 127518

|
|
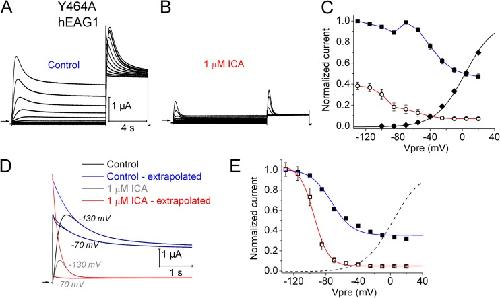
Figure 5. Effect of 1 µM ICA on Y464A hEAG1 channel currents. (A) Control Y464A hEAG1 currents elicited with two-pulse protocol, where Vh was −100 mV and Vpre was 10 s in duration and ranged from −130 to +20 mV applied in 15-mV increments, each followed by a test pulse to +30 mV. (B) Currents recorded after steady-state inhibition of hEAG1 by 1 µM ICA. (C) Voltage dependence of activation (◆) and inactivation in the absence (■) and presence (○) of 1 µM ICA. For control activation, V0.5 = −15.1 ± 2.1 mV and z = 1.31 ± 0.02 (n = 8). (D) Test-pulse currents recorded at +30 mV after Vpre to −130 and −70 mV during control and after 1 µM ICA. Traces were fitted with two-exponential function and extrapolated back to the start of the pulse for control (blue curves) and after 1 µM ICA (red curves). (E) Extrapolated Imax–Vpre relationships for control (■) and after 1 µM ICA (□). Dashed curve is same activation curve plotted in C. For control inactivation, V0.5 = −73.3 ± 0.7 mV and z = 1.44 ± 0.05 (n = 8). For 1 µM ICA, V0.5 = −94.3 ± 1.9 mV and z = 3.78 ± 0.16 (n = 8). Image published in: Garg V et al. (2012) © 2012 Garg et al. Creative Commons Attribution-NonCommercial-ShareAlike license Larger Image Printer Friendly View |
