XB-IMG-123681
Xenbase Image ID: 123681
|
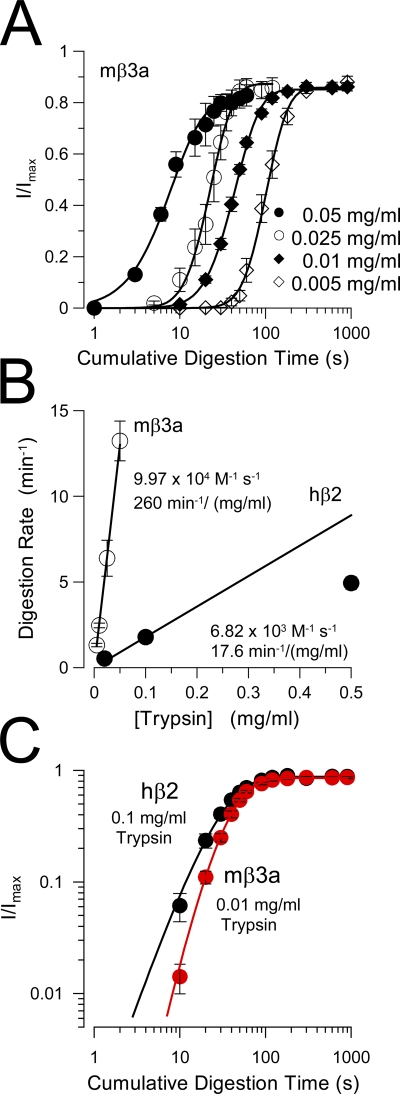
Figure 7. Comparison of removal of inactivation mediated by hβ2 and mβ3a. (A) The removal of mβ3a-mediated inactivation is plotted for four different trypsin concentrations. Fitted time constants of digestion were 5.83 ± 1.2 s (0.05 mg/ml), 10.5 ± 1.42 s (0.025 mg/ml), 23.72 ± 1.41 s (0.01 mg/ml), and 44.22 ± 3.74 s (0.005 mg/ml). (B) The effective digestion rate (min−1) is plotted as a function of trypsin concentration for both mβ3a and hβ2 (from Zhang et al., 2006). The line through the mβ3a points corresponds to a linear fit with a slope of 260 min−1/mg/ml, which assumes a molecular weight of 24 kD for trypsin corresponds to 9.97 × 10⁴ M−1 s−1. For β2, the line corresponds to the slope through the two lowest trypsin concentrations, yielding a maximal effective rate of 6.82 × 10³ M−1 s−1. (C) A log-log plot of the digestion time course for hβ2 (black circles) and mβ3a (red circles) compares the slope of the digestion process. For β2, n = 2.21 ± 0.23; for β3a, n = 3.62 ± 0.39. Note that in A, except for the time course observed with 0.05 mg/ml, the steeper slope of β3a digestion is independent of trypsin concentration. Similarly, the slope of β2 digestion is independent of trypsin concentration (not depicted). Image published in: Zhang Z et al. (2009) © 2009 Zhang et al. Creative Commons Attribution-NonCommercial-ShareAlike license Larger Image Printer Friendly View |