XB-IMG-126735
Xenbase Image ID: 126735
|
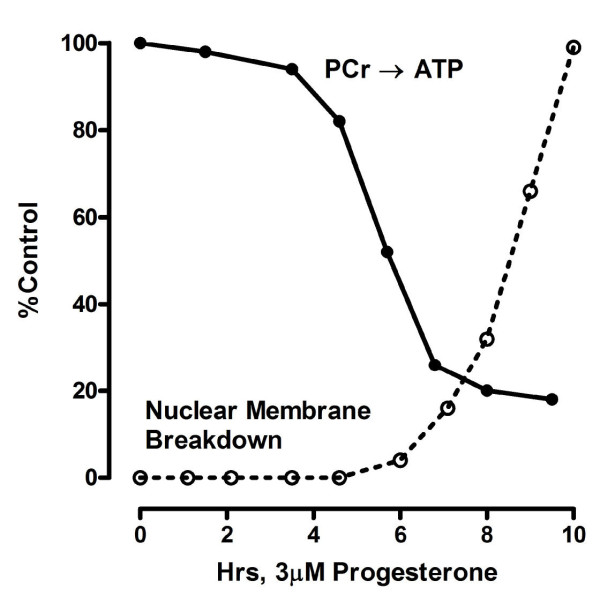
Figure 5. Comparison of changes in the NMR-measured pseudo first order rate constant (kf) for the reaction PCr → ATP and the time course of nuclear membrane breakdown during the first 10 h. Values are expressed as a percent of those for untreated follicles from the same female. Image published in: Morrill GA et al. (2011) Copyright ©2011 Morrill et al; licensee BioMed Central Ltd. Creative Commons Attribution license Larger Image Printer Friendly View |