XB-IMG-117451
Xenbase Image ID: 117451
|
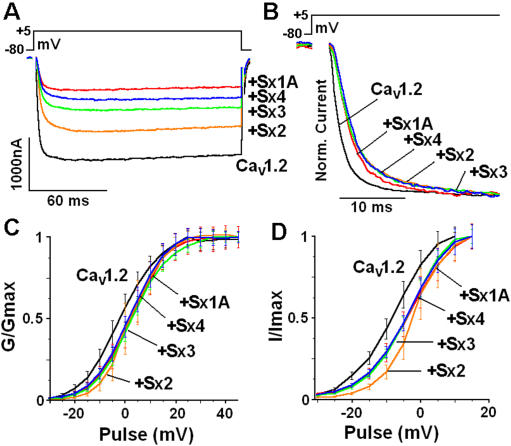
Figure 6. Comparison of syntaxin isoforms effects on the kinetics of Cav1.2. Cav1.2 subunits were co-injected with syntaxin isoforms (data from Figure 3).Ba2+ currents were elicited from a holding potential of –80 mV by a voltage step applied to +4 mV in response to 160 ms pulse duration. (A) Superposition of representative online leak-subtracted current traces measured with Sx isoforms as indicated with voltage protocols diagramed at the top. (B) The first 30 ms of the response is shown. The normalized traces show a shift of Cav1.2 activation by Sx isoforms. (C) Normalized conductance–voltage (G/Gmax) relationship obtained from (Fig. 3.B) displayed with a Boltzmann fit. The mid-point of activation (V1/2) and the Boltzmann slope (k) of Cav1.2 were: V1/2 = −7.6±0.2 mV, k = 6.3±0.3; with Sx 1A, V1/2 = −3.5±1.9 mV; k = 5.9±1; with Sx 2, V1/2 = −1.8±1.9 mV; k = 5±0.6±1; with Sx3, V1/2 = −3.7±0.9 mV, k = 5.9±0.5; and with Sx 4, V1/2 = −3.5±1.4 mV; k = 6.3±0.7. (D) Peak current amplitudes normalized to maximum current (I/Imax) (data from Fig. 3B) are plotted against test potentials and displayed with a Boltzmann fit. The data points correspond to the mean±S.E.M. (n = 10–12). Statistical significance was determined by Student's t-test. Image published in: Cohen R et al. (2007) Cohen et al. Creative Commons Attribution license Larger Image Printer Friendly View |