XB-IMG-126457
Xenbase Image ID: 126457
|
|
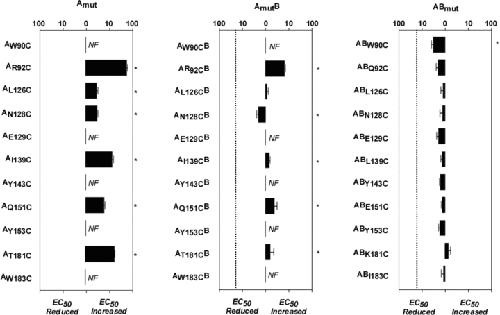
Figure 3. Relative EC50 values of wild-type and mutant receptorsAsterisks denote statistically different from wild-type. NF: non-functional at 100 μm 5-HT, or with an EC50 too high to be accurately determined. Relative values are shown as the differences ± SED. Data from Table 1. The dotted line represents the difference between wild-type 5-HT3A and wild-type 5-HT3AB responses. Image published in: Thompson AJ et al. (2011) Image downloaded from an Open Access article in PubMed Central. Journal compilation © 2011 The Physiological Society Larger Image Printer Friendly View |