XB-IMG-125879
Xenbase Image ID: 125879
|
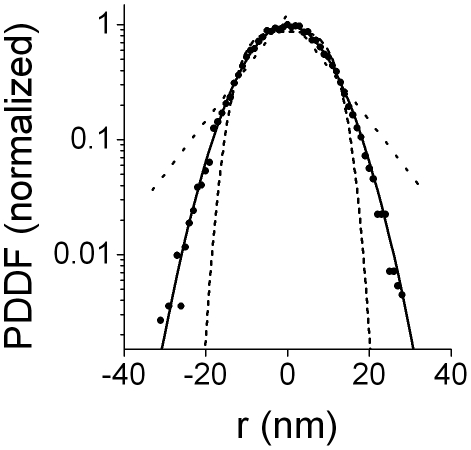
Figure 2. Analysis of melanosome position density distribution function.80 segments of trajectories corresponding to kinesin-driven melanosomes in MSH-stimulated cells were analyzed as described previously to obtain . These data were used to calculate the normalized particle density distribution function PDDF()/PDDF(0) using Δ = 1 nm. The continuous black line shows the fitting of equation (3); dotted and dashed lines represent the fitting of models corresponding to cone and r4 potentials, respectively. Image published in: Bruno L et al. (2011) Bruno et al. Creative Commons Attribution license Larger Image Printer Friendly View |