XB-IMG-124862
Xenbase Image ID: 124862

|
|
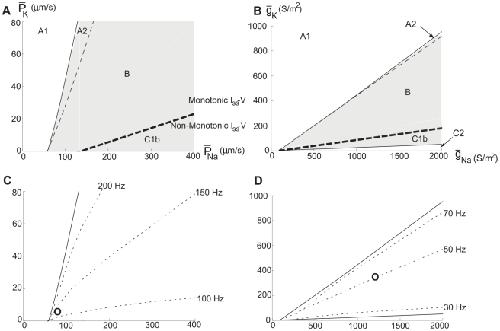
Figure 13. Oscillation maps for the axon models.Regions associated with oscillations in the − or − plane. (A) The frog myelinated axon model. (B) The squid giant axon model. As seen there is no C1a region in any of the maps and consequently both axon models lack Type 1 dynamics. Note also that the myelinated axon model (A) allows oscillations for = 0 (no K channels). (C) Onset frequency in the myelinated axon model. (D) Onset frequency in the squid axon model. Circles indicates the original values used by Hodgkin and Huxley for the model of the axon of Loligo forbesi [23] and Frankenhaeuser and Huxley for model of the sciatic nerve of Xenpus leavis [22]. Image published in: Zeberg H et al. (2010) Zeberg et al. Creative Commons Attribution license Larger Image Printer Friendly View |
