XB-IMG-128050
Xenbase Image ID: 128050
|
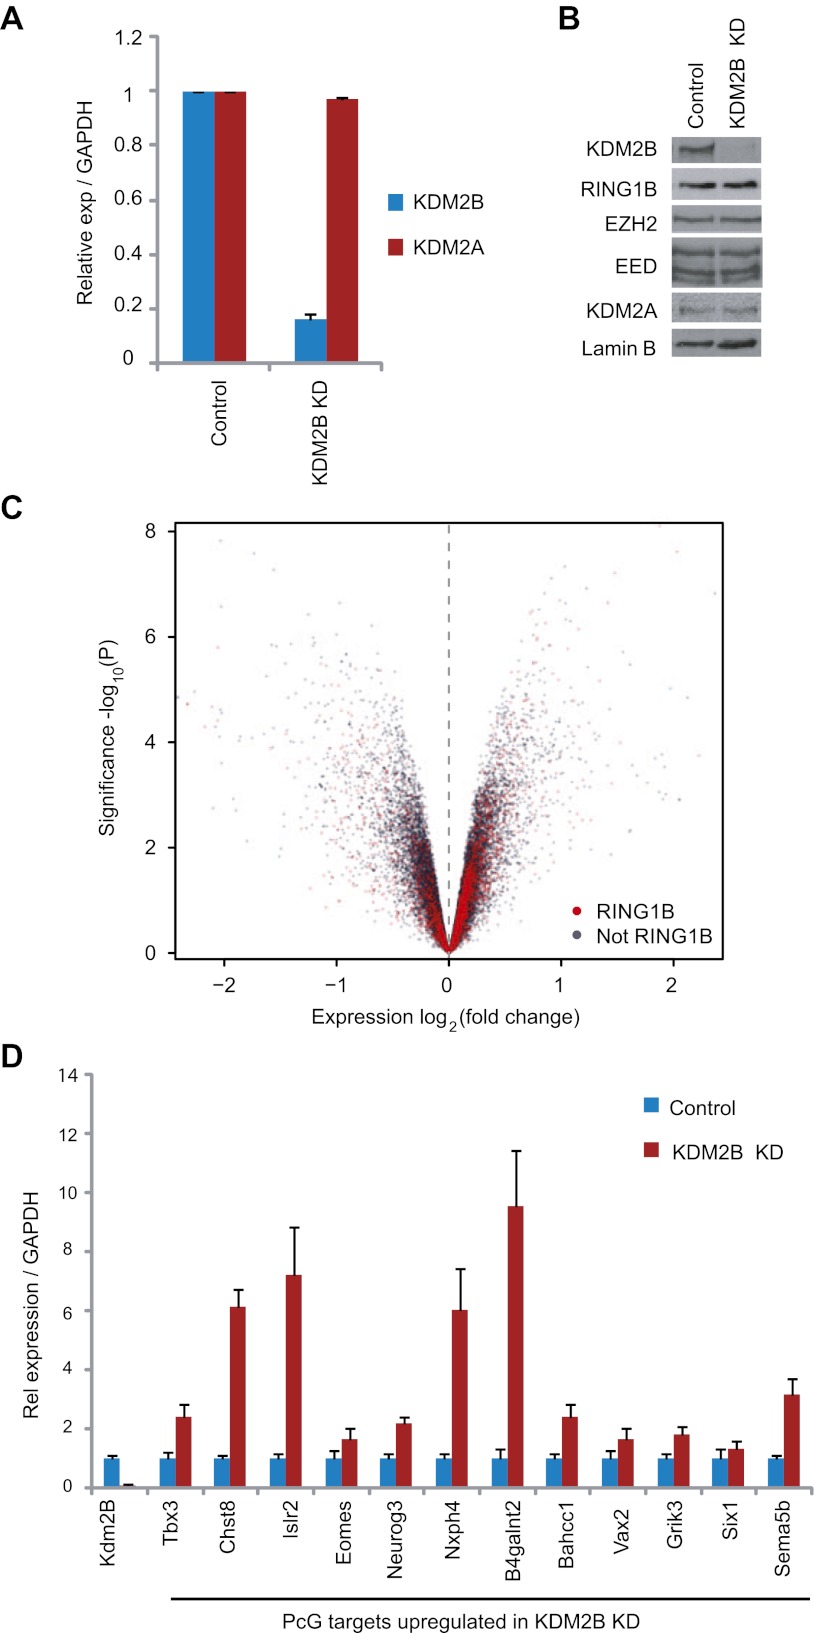
Figure 5. KDM2B depletion in ESCs results in the up-regulation of a subset of polycomb repressed target genes.(A) RT-PCR showing reduction of KDM2B at the mRNA level in the knockdown (KD) but not control cell line. The levels of the closely related KDM2A mRNA were not affected. Error bars represent SEM of three biological replicates. (B) Western blot analysis showing that KDM2B knockdown depletes KDM2B but not the closely related KDM2A protein. Importantly depletion of KDM2B does not destabilize other polycomb group proteins including RING1B, EZH2 or EED. Lamin A/C indicates equal loading. (C) A volcano plot illustrating the gene expression changes in the KDM2B depletion line compared to the control cell line. The x-axis corresponds to fold change and the y-axis to the significance level. RING1B associated genes are coloured red and show preferential enrichment in the genes up-regulated upon KDM2B knockdown. (D) A panel of polycomb target genes identified in microarray analysis that were up-regulated upon depletion of KDM2B were validated by RT-PCR analysis. In most cases the level of up-regulation was more pronounced when analysed by RT-PCR. Error bars represent SEM of four biological replicates. Values are normalized to Gapdh and expression in the control line set to 1.DOI:
http://dx.doi.org/10.7554/eLife.00205.010 Image published in: Farcas AM et al. (2012) Copyright © 2012, Farcas et al. Creative Commons Attribution license Larger Image Printer Friendly View |