XB-IMG-127037
Xenbase Image ID: 127037
|
|
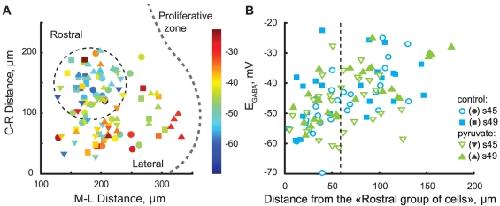
Figure 4. Spatial gradient of GABAR reversal potential in the OT.A. All cells that had their position within OT recorded (n = 105), for both stages and ACSF formulations, shown projected onto open right OT outline. Rostral direction is up, caudal is down, medial is left, lateral is right. Circles stand for cells recorded in control ACSF at stage s45; squares – control ACSF s49; down triangles – pyruvate-containing ACSF s45; up triangles – pyruvate-containing ACSF s49. Color of the marker encodes EGABA measured in each of the cells, with blue corresponding to more negative, and red – to more positive values (see color-bar on the right). Subset of cells further referred to as the “Rostral group” is encircled with a dashed circle. B. EGABA observed in OT cells as a function of distance from the center of the “Rostral group” shown on the left. Blue for control ACSF; green for pyruvate-containing ACSF; marker shapes follow same conventions as in the left panel. The threshold distance limiting the “Rostral group” is shown as a dashed line. Image published in: Khakhalin AS and Aizenman CD (2012) Khakhalin, Aizenman. Creative Commons Attribution license Larger Image Printer Friendly View |