XB-IMG-117219
Xenbase Image ID: 117219
|
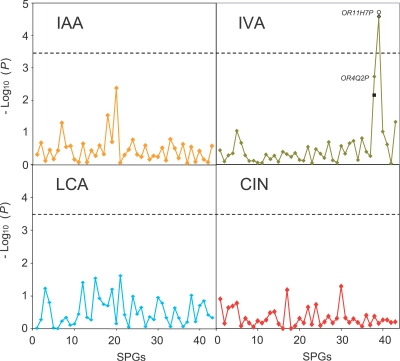
Figure 2. Genotype–Phenotype AssociationANOVA p-values for comparison between the olfactory threshold distributions of participants with homozygous disrupted genotypes versus heterozygous and homozygous intact genotypes (1 df), using “gender” and “gender by genotype” as covariates. SPG loci are enumerated as in Table S2. The broken line indicates the statistically significant value of p = 0.05 after Bonferroni correction for 172 tests (four odorants × 43 SPGs). The two strongest p-values for IVA are for the genes marked in Figure 3. Using the individual's average threshold towards the four odorants as an additional covariate did not change the association signal with OR11H7P (open circle in IVA panel). The association signal with OR4Q2P is reduced after adjusting for the OR11H7P effect (solid square in IVA panel). Image published in: Menashe I et al. (2007) Copyright: © 2007 Menashe et al. Creative Commons Attribution license Larger Image Printer Friendly View |