XB-IMG-145867
Xenbase Image ID: 145867
|
||||||||||
|
ATTTGCCTFig.
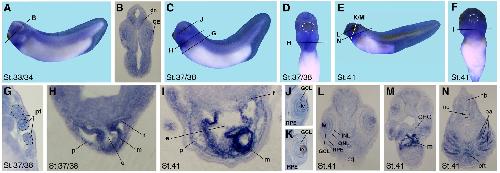
9. Tissue specific expression of crip3 in Xenopus embryos stage 33/34, 38 and 41. (A,C,E) Lateral views with anterior to the left. (D,F) Ventral views with anterior to the top. White dotted circles depict the cement gland. (B, G-N) Transversal vibratome sections through different regions of the embryos with the dorsal to the top as indicated by the lines shown in A,C-F. The pronephric tubules (pt) and notochord (nc) are depicted by dashed circles, respectively (G,N). (B,G) Crip3 transcripts were weakly expressed in the differentiated neurons (dn, B) and in the pronephric tubules (pt, G). (H-I,M-N) The strongest expression of crip3 was found in the developing heart, namely the outflow tract (oft), the peri- and myocardium (p, m) as well as in the pericardial roof (r) and endocardium (e). (B,J-L) Sections through the eye showed a weak crip3 expression in the cornea epithelium (CE) at stage 33/34 (B) and in the ganglion cell layer (GCL) and lens (le) at stage 37/38 and 41, while the inner and outer nuclear layers (INL, ONL) and the retinal pigmented epithelium (RPE) were negative for crip3 (J-L). (M-N) At stage 41 crip3 was expressed in the ceratohyal cartilage (CHC) and the branchial arches (ba). cg cement gland, hb hindbrain. Image published in: Hempel A and Kühl SJ (2014) Copyright © 2014. Image reproduced with permission of the Publisher, University of the Basque Country Press.
Image source: Published Larger Image Printer Friendly View |