XB-IMG-125520
Xenbase Image ID: 125520
|
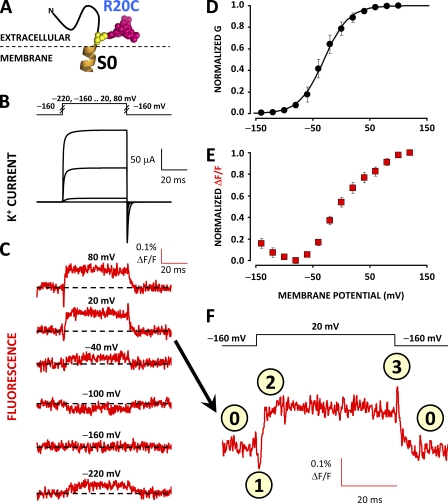
Figure 4. TMRM at position 20 tracks two distinct voltage-dependent processes. (A) A unique cysteine was substituted at position 20 at the putative N-terminal flank of S0 in a BKCa channel α subunit and covalently labeled with the fluorophore TMRM to resolve conformational rearrangements from this region. (B) Voltage pulses and characteristic evoked K+ currents from BKCa channels labeled with TMRM at position 20. (C) TMRM fluorescence traces recorded during the voltage pulses in B. Note that, contrary to ΔF/F signals observed from other positions in BKCa, fluorescence recordings to 20 or 80 mV exhibit transient deflections at the onset and termination of the test pulse. (D) Normalized K+ conductance (black circles) fit with a Boltzmann distribution (black curves). Boltzmann parameters are listed in Table I. Error bars represent SEM. (E) Normalized steady-state fluorescence. The biphasic relationship implies that two processes with opposite effects on fluorescence intensity (quenching/dequenching) and steady-state voltage dependence influence TMRM fluorescence when labeling position 20. (F) Magnification of the fluorescence trace for a 20-mV depolarization from C. In this scale, the fluorescence transients (events marked 1 and 3) are more easily observed. Image published in: Pantazis A et al. (2010) © 2010 Pantazis et al. Creative Commons Attribution-NonCommercial-ShareAlike license Larger Image Printer Friendly View |