XB-IMG-151177
Xenbase Image ID: 151177
|
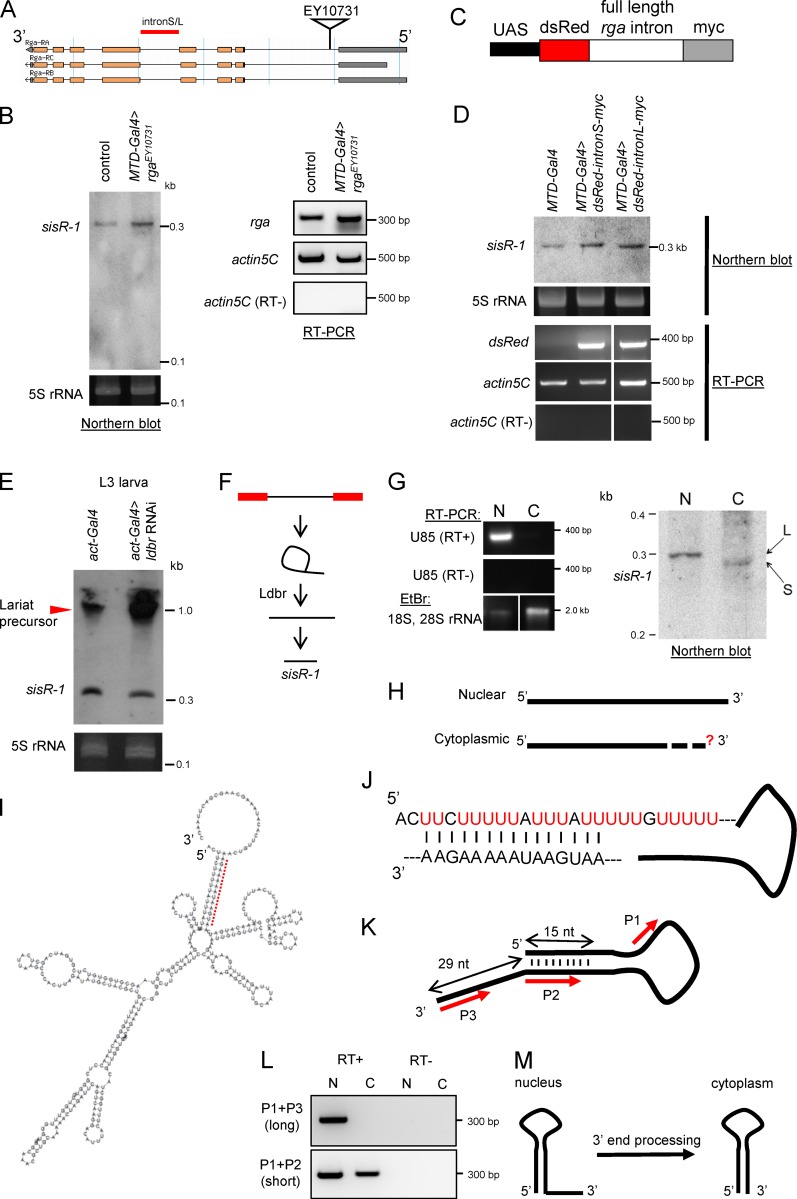
Figure 3. Processing of sisR-1. (A) Diagram showing the insertion of an EP element EY10731 used to overexpress the rga pre-mRNA. L, long; S, short. (B) A Northern blot showing expression of sisR-1 in the ovaries of controls versus rga overexpression flies. RT-PCR showing expression of rga mRNA and actin5C in the ovaries of controls versus rga overexpression flies. (C) Diagram showing the construct used to overexpress rga intronic sequences. (D) Northern blot showing expression of sisR-1 in ovaries of controls versus rga intronic sequence overexpression flies. RT-PCR verifies expression of dsRed mRNA in the ovaries of dsRed-intron-myc overexpression flies but not in controls. (E) Northern blots showing expression of sisR-1 in the controls versus ldbr RNAi third instar larvae. (F) Model for processing of sisR-1 from the rga pre-mRNA. (G) Northern blot showing detection of sisR-1 in both the nuclear (N) and cytoplasmic (C) fractions of 14–24-h embryos. RT-PCR showing the expression of U85 only in the nuclear fraction. EtBr staining showing the enrichment of 18S, 28S rRNA in the cytoplasmic fraction. RNAs were run on the same gel, and the intervening lanes were removed (white vertical lines). (H) Diagram showing the 5′ and 3′ ends of the nuclear and cytoplasmic sisR-1 determined by RACE. Question mark depicts unknown 3′ end of cytoplasmic sisR-1. (I) Predicted structure of nuclear sisR-1 by Vienna RNA fold software. Red dotted region is shown in J. (J) Magnified view of the dotted region in I shows the base pairing. (K) Diagram with red arrows to indicate regions where the primers anneal to. (L) RT-PCR showing the detection of the short, but not long, isoform of sisR-1 in the cytoplasmic fraction. (M) Model showing the processing of nuclear sisR-1 to cytoplasmic sisR-1 by 3′ end processing. Image published in: Pek JW et al. (2015) © 2015 Pek et al. Creative Commons Attribution-NonCommercial-ShareAlike license Larger Image Printer Friendly View |