XB-IMG-118441
Xenbase Image ID: 118441
|
|
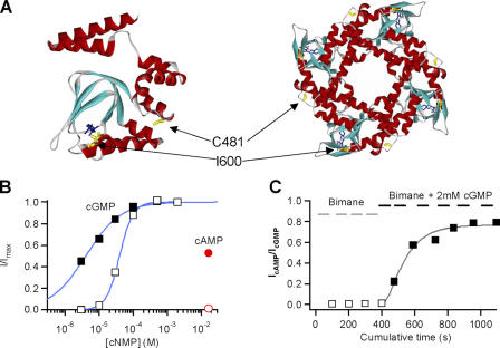
Figure 2. Characteristics of the C481 mutation. (A) Location of residues C481 and I600 in a homology model of the CNGA1 carboxy-terminal region based on the x-ray crystal structure of HCN2. (B) Cyclic nucleotide dose–response relations of unmodified and modified channels. Open squares are the cGMP dose–response data before modification. The smooth curve is a fit of Eq. 1 with Kd = 40 μM and n = 2.2. The open circle is the response to 16 mM cAMP, before modification. Closed squares are the cGMP dose–response data of the same patch after complete modification with 250 μM bimane maleimide in the presence of 2 mM cGMP. The data were fit with Eq. 1, with Kd = 4.0 μM and n = 0.84. The closed circle is the response to 16 mM cAMP after modification. (C) Time course of C481 modification by 400 μM bimane maleimide. Application of bimane maleimide in the absence or in the presence of 2 mM cGMP is indicated by the gray and black bars, respectively. Modification, as measured by the potentiation of the current in 16 mM cAMP relative to the current in 2 mM cGMP, occurs exceedingly slowly in closed channels (open squares), but proceeds with a rate constant of 29 ± 3.9 M−1s−1 (n = 3) in open channels (solid squares). The smooth line is a fit of Eq. 2 with a rate k = 0.0098 s−1 and m = 2. Image published in: Islas LD and Zagotta WN (2006) Copyright © 2006, The Rockefeller University Press. Creative Commons Attribution-NonCommercial-ShareAlike license Larger Image Printer Friendly View |