XB-IMG-123161
Xenbase Image ID: 123161
|
|
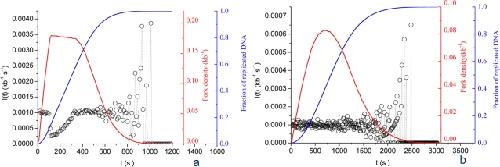
Figure 2. Computed I(t) for stationary scenarios.Open circles are numerical simulation data points. (A) Particle recycling scenario: NT = 104;. P = 10−3 kb−1 s−1. (B) Particle abundance scenario: NT = 105; P = 10−4 kb−1 s−1. Blue and red curves represent the simulated replicated fraction and the fork density, respectively. Image published in: Goldar A et al. (2008) Goldar et al. Creative Commons Attribution license Larger Image Printer Friendly View |