XB-IMG-123073
Xenbase Image ID: 123073
|
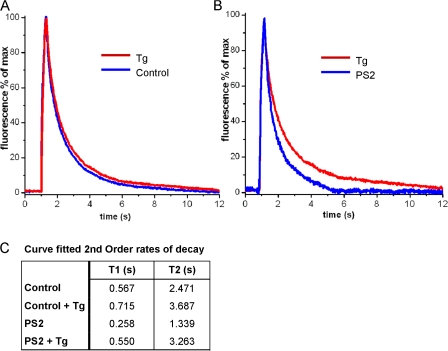
Figure 4. Thapsigargin-sensitive cytosolic Ca2+ sequestration is bigger in PS2-expressing oocytes as compared with control oocytes. (A) Traces show Ca2+-dependent fluorescent signals obtained in control and PS2-expressing oocytes in the absence of (control) and during application of 30 μM thapsigargin (Tg) in the bathing solution. (B) Comparison of thapsigargin-sensitive component of cytosolic Ca2+ clearance in control oocytes versus PS2-expressing oocytes. Traces were obtained by direct subtraction of records obtained in the presence of 30 μM thapsigargin minus records obtained in the absence of thapsigargin. (C) Table listing fast (T1) and slow (T2) time constants of double-exponential fits to the Ca2+ decay data. Image published in: Green KN et al. (2008) © 2008 Green et al. Creative Commons Attribution-NonCommercial-ShareAlike license Larger Image Printer Friendly View |