XB-IMG-125888
Xenbase Image ID: 125888
|
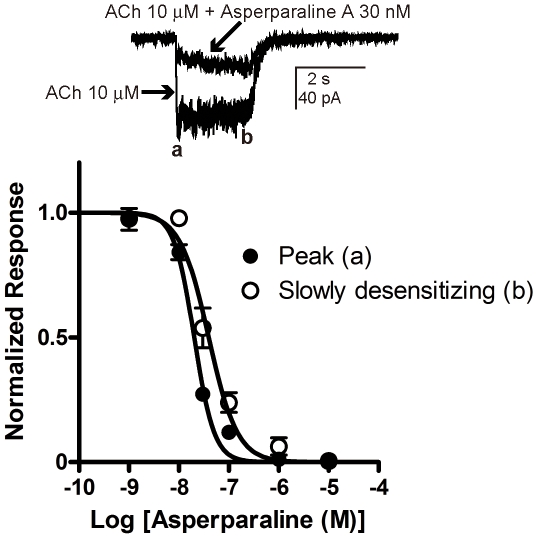
Figure 5. Concentration-inhibition curves for asperparaline A in terms of
attenuation of the responses to ACh of the silkworm larval
neurons.(A) The ACh-induced responses recorded before and after bath-application
of asperparaline A for 1 min prior to co-application with 10 µM
ACh. The peak and slowly desensitizing currents are indicated by
“a” and “b”, respectively. (B)
Concentration-inhibition curves for asperparaline A. Data were
normalized to the maximum response to ACh (10 µM). Each plot
represents the mean ± the standard error of the mean of 4
experiments. The concentration-inhibition curves were obtained by
fitting the data to Eq. (1) (see Materials
and Methods). The pIC50
( = log(1/IC50) values for the peak
and slowly desensitizing currents were 7.69±0.02
(n = 4, IC50 = 20.2
nM) and 7.40±0.04 (n = 4,
IC50 = 39.6 nM), respectively. These two
values are significantly different (p<0.05,
t-test). Image published in: Hirata K et al. (2011) Hirata et al. Creative Commons Attribution license Larger Image Printer Friendly View |