XB-IMG-125743
Xenbase Image ID: 125743

|
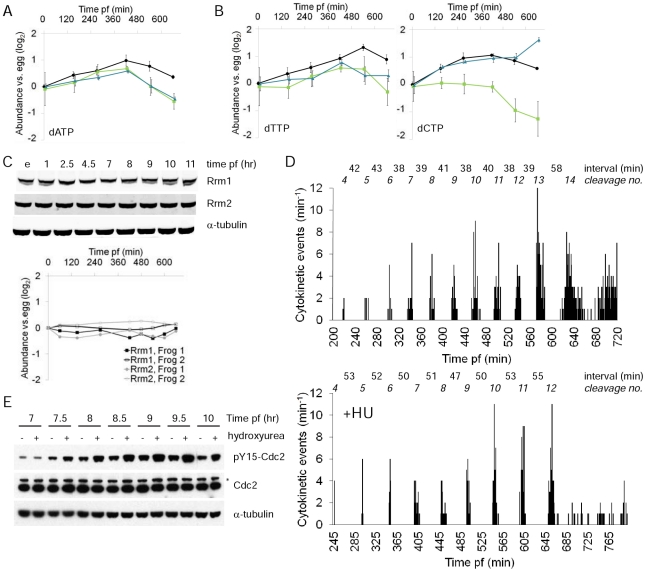
Figure 4. Evidence suggesting that dATP limitation triggers the MBT.(A,B) Plots of dATP, dTTP, and dCTP abundance during early development. dGTP was not measurable in part due to interference from ATP, which is much more abundant. The MBT occurs 8 hours post-fertilization (pf), see Figure 1B. Results plotted as for Figure 1C. Error bars are ± 1SD. (C) The two subunits of ribonucleotide reductase (Rrm1, Rrm2) do not change in abundance during early development. Western blotting of unfertilized eggs and embryos from two different females frogs was quantified (bottom panel). (D) Time lapse imaging of the MBT in unperturbed embryos (top panel) and embryos incubated in 20 mM hydroxyurea (HU, bottom panel). The animal pole of single embryos was imaged and the timing of each cytokinesis recorded. The time interval between each synchronous group of cell divisions is noted. The two embryos are descended from different frogs on different days. There was notable variation in the time interval between cleavage events in otherwise unperturbed, imaged embryos (data not shown), so the longer intervals in HU treated embryo are not necessarily due to HU toxicity. (E) Hydroxyurea causes hyperphosphorylation of Y15 on Cdc2 beginning at the MBT, 7.5 hours after fertilization. Embryos were incubated at 18°C for 3 hours and then the temperature slowly raised to 23°C, accounting for the slightly more rapid entry into the MBT than in Figure 1B. * indicates a non-specific band. Image published in: Vastag L et al. (2011) Vastag et al. Creative Commons Attribution license Larger Image Printer Friendly View |
