XB-IMG-155243
Xenbase Image ID: 155243
|
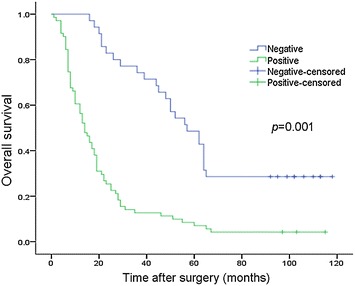
Fig. 5. Correlation of TPX2 expression with patient overall survival in gastric carcinoma. Kaplan–Meier curves with univariate analysis (log-rank). OS rates for cases with high TPX2 expression versus those with low TPX2 expression levels in all patients. High TPX2 expression was correlated with an unfavorable prognosis (P = 0.001) Image published in: Shao C et al. (2016) © The Author(s) 2016. Creative Commons Attribution license Larger Image Printer Friendly View |